The Maps module in Enterprise Evolver offers you many visual modeling techniques to create models, views and blueprint of your business by associating and relating items belonging to different business parts. You can use these maps to understand how different parts (e.g. organization categories) of your business work together to deliver value to your customers or generate revenue. Additionally, you can identify issues, gaps, and analyze your business environment in many ways such as:
- Redundancies: The same capability may be implemented by multiple application systems. Or deducting redundant capabilities by more than one project by mapping projects (or initiatives) to capabilities.
- Overlaps: Some application systems may implement multiple capabilities or portions of capabilities. It is common to have both redundancies and overlaps.
- Gaps: Capabilities that have been identified as necessary to meet (new) business requirements do not yet exist.
- Pain Points. Customer pain points showing the journey through the different touchpoints that characterize customer’s interactions.
- Isolated Parts. Identify isolated parts which are not linked to any other part and identify business risks.
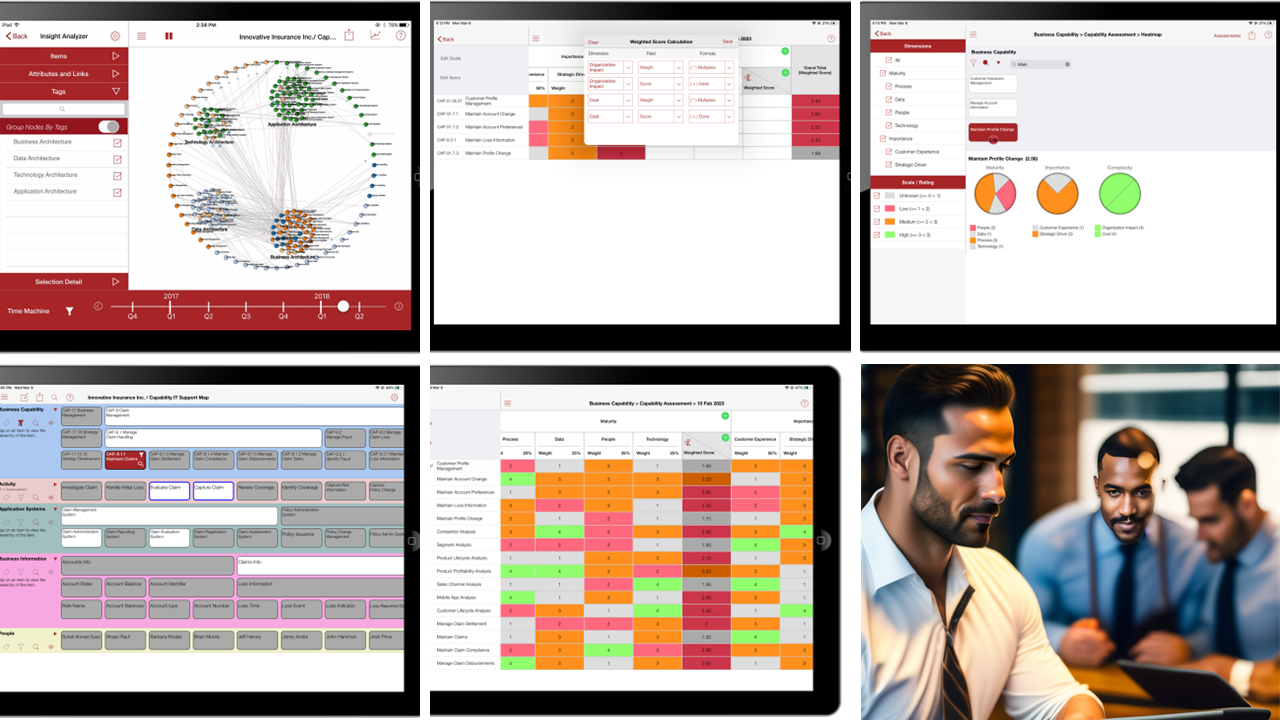
Maps & architecture views created using Maps feature only offers the partial glimpse of an enterprise reality because in most cases these are created from a point of specific stakeholder. To create the Big Picture and to visualize the architecture continuum, the Insight Analyzer module is used for all kind of analysis and pattern discovery. The Maps module focuses on capturing and modeling specific views and blueprints, whereas the Insight Analyzer focuses on total visualization.
Visual Editor:
The Visual Editor provides a quick way to create a map allowing you to add/remove new links & tags, decorate the map, add new categories & items and sequence items in a row/category. The List Editor provides the similar functionalities but through a traditional user List interface. The List Editor does not provide the link functionality. You can link items from visual editor only.
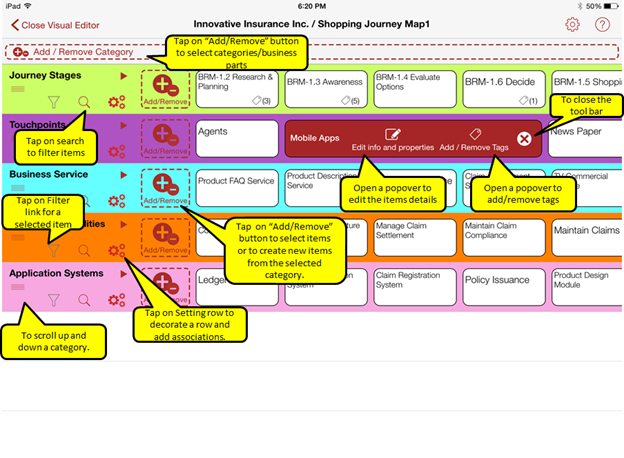
The Visual Editor is opened when you tap on the Visual Editor link from the Edit popover on the Modeling Editor. The Visual Editor provides visual modeling functionalities for creating and managing maps. The editor offers following functionalities:
- Add/Remove Category- You can add categories to a map or remove existing categories from map. Additionally, you can also create new categories directly from this functionality.
- Global Setting – This function offers you a quick way to set certain functionalities globally for a map instead of setting it individually for each category. You can group family items to display them together.
- Add/Remove Items- You can add items to a category or row or remove existing items from the row. Additionally, new items can be created directly from this functionality. You can simply change the sequence of items by simply dragging and dropping items from one position to another.
- Row setting – Use this feature to decorate items and add associations to categories.
- Item Tool bar – The item tool bar functionality allows to quickly edit items details, add/remove tags and add/remove links.
- Row sequence – Use the sequence icon to change the order of row in which you want to display in a map.
- Item sequencing- Simply select an item to move from one position to another and change the order of display. This is important when you want to show a flow in certain sequence from left to right.
Visual Editor Components
You can customize your map using the Visual Editor in the following ways:
- Adding categories (e.g. business parts ) and objects to the map
- Hiding or reordering a row, changing a row color to visually group elements in the same row on the canvas.
- Create links between categories.
- Add tags to child objects.
- Editing item details
- Sequencing items within a row
- Sequencing a row
- Enabling group and gray out feature at the map level or row
Adding Categories (Business parts)
Steps to add categories to a map:
- Tap on
 to add or remove categories to the map. If a category does not exist in the popover list, you can also create a new category by tapping on the ‘Edit’ link.
 - If the map was created using a viewpoint template then you can skip the step 1 above unless you want to include additional categories or remove existing categories.
- Select the categories that you want to add to the map by tapping on the checkbox against the category.
- Tap Done to view the selected categories on the Canvas.
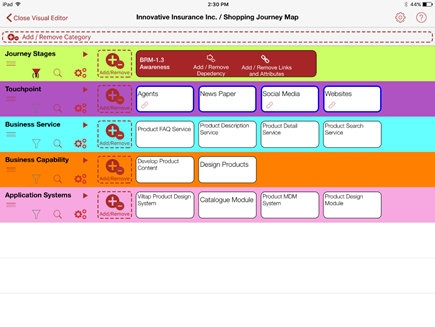
The canvas will display the selected categories without any items. The next step is to add items for each category.
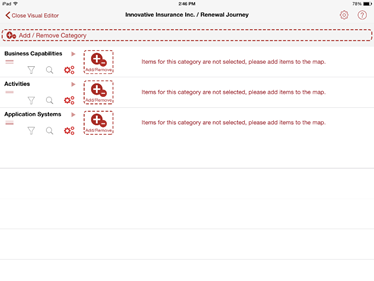
Categories with no items
Note: Categories can be sequenced and re-sequenced by tapping on icon. The sequenced categories will be displayed from top to bottom on the canvas.
Adding Items
Steps to add objects (e.g. Category items) to a map:
- Tap on
 to add items for every category. If items already exist for the category, you will see a list of items in the popover. If there are no items then the list will be blank and you need to add new items for the category. You can directly add new items from the popover by tapping on the ‘Edit’ link.
 - Select the items that you want to add to the map by tapping on the checkbox against the items.
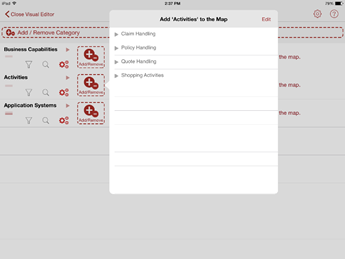
Add Items
Note: Items can be sequenced and re-sequenced by ![]() tapping on an item and moving around on the row.
tapping on an item and moving around on the row.
Decoration and Association
Evolver allows you to decorate the categories and items in the canvas by changing the background colors and shapes. Categories are associated in the map by tapping on Add/Remove Category icon.
- Tap on
 for decorating a map and associating two or more categories.
 - Set various properties by tapping on ‘Decoration’ Tab. Many properties are very useful for visualizing a map.
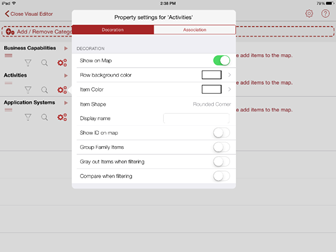
Decoration and Association
- Set ‘Group Family Items’ property to group items belonging to the same family. The map will automatically group the items together while displaying the hierarchy.
- Set ‘Gray out Items when filtering’ property can be used to gray out items instead of hiding items when a filter is applied. This property is useful in scenarios where you want to visually display all the parts that come into play to respond to a particular scenario or situation of your business. All unrelated items are grayed out when filter is applied.
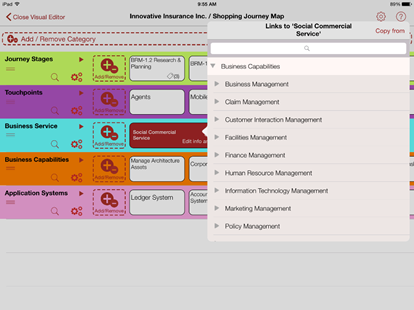
3. Tap on ‘Association’ to associate categories with the selected category. The filter feature only works when categories are associated. This is a very important step because after the categories are associated to each other the items are linked from one category to another and the filter functionality can be applied.
- Tap on ‘Association’ to see a list of relationship that exist for the selected category.
- Tap on a category to associate the category with the selected category.
- You can ‘Dissociate’ categories from the list of associated categories by tapping on ‘Dissociate’.
- If you don’t see any category to associate then you should first create the association from the System Editor.
- If a map was created using a template, the Evolver automatically establishes all the necessary association. Of course, you can add additional association as per your need.
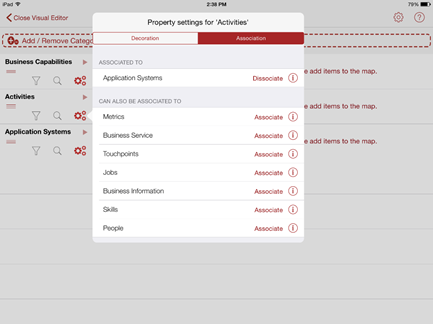
Category Association & Dissociation
Creating Tags
Tags allow you to assign keywords to items in a map. When you add tags to items, you can use these tags easily to search for items in the map. You can only create tags for items that do not have any child items. You can use tags for many different purpose such as capturing issues for certain capabilities or application systems or adding tags for your touchpoints to capture information such as moments of truth or micro moments or customer behavior (Needs, Feelings, Action etc.) in a customer journey map. In Insight Analyzer, Tags are also used to group a network graph into radial layout forming clusters of nodes for pattern discovery and complex analysis. Each child item can be related to one or more tags. Tags allow you to categorize objects using keywords.
Steps to add tags for an object:
- In the Visual Editor, select an item that you want to link by tapping on it. A red tool bar will appear like below.

The Tool bar for Tagging Items
- Tap on Add/Remove tags link.
- On the pop-over, select from the available tags. If the tag you are looking for is not available, you can create your own tags.
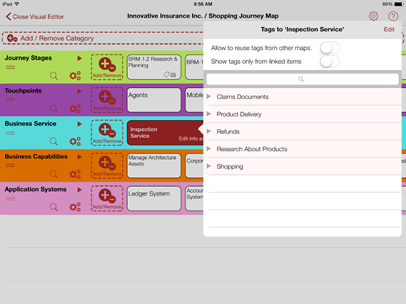
Tags Popover
Connection Modeling- Link & Dependency
Enterprise Evolver offers an ability to connect, associate and link instances of one business part to another. Connection can describe the nature of relationships between various business parts/categories; how they relate to one another; how they interface; how they facilitate the flow and transfer of data, information, money and other resources. You can also capture connection start and end date and this information can be used to visualize the network graph of your business.
There are two ways ‘Link’ and ‘Dependency’ for modeling a connection.
- Capturing Links
Links allow you to create connection between two objects or items of different business parts/categories. For example: You can connect instances of Business Capability to the instances of Activity. You can only link items that do not have child items. During linking, you can capture certain attributes for each links, for example capturing pain points or using attribute to capture current and future state of an application system or capturing certain message. If you have to capture how two business parts facilitate the flow and transfer of information/data, money and other resources, then you would like to use ‘Flow’ type from the list when you create an attribute, for example to show exchange of data between an activity and application.
You can only capture a link between two items of different categories when the association between these two categories are already established. To capture a dependency, association is not needed.
Note: You can capture link/dependency only from the Visual Editor. The List Editor does not allow this functionality.
After you have associated categories, you can link objects within the associated categories. Links allow you to connect objects from two different categories.
Steps to link objects from the Visual Editor:
- In the Visual Editor, select an item that you want to link by tapping on it and then tap on Filter icon. A tool bar will appear like below.
The Tool Bar for connecting Items
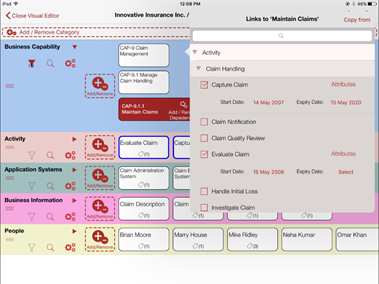
- Tap Add/Remove Links. A pop-up will display the list of objects that the selected object can be linked to.
Popovers for linking Items
- Select the items that you want to link.
Note: You can only link items at the lowest level in the hierarchy; this means that you can only link items that do not have any child items.
Reusing Links
You can also re-use existing links from other maps into the map that you are working on. Tap on the ‘Copy from’ option from the link popover, the app will automatically show you a list of existing maps containing links for reusing. Select the map that you want to use for reusing links.
Connection/Link Dates
For every connection, you can also capture the date when the connection was established (e.g. Start Date) and the date when the connection was expired (e.g. Expiry date). This information is used to visualize a network graph (see the Insight Analyzer section) using the time machine option. When an expiry date is captured for a link, the link in the graph is shown with a dotted red line.
Connection Dates
Capturing Attributes
For every link, you can capture attributes as well. Attributes provides a way to capture many things for a given link such as pain points, cost, map state (current or future), any message that flow through the link etc. These link attributes are visible in the map through a link icon. The icon also show the number of the attributes specified in the link. Attributes are reusable across maps. Use the ‘Flow’ type to capture information that flow between two items. This information can be visualized on the links in a graph map. For example, between two activities you would like to capture flow of any things such as value, information, fund etc. In another example, you would also to capture certain exchanges between two systems. You can use the ‘Flow’ type to show the exchanges.
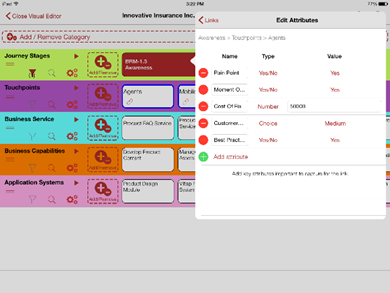
Adding Attributes
In Insight Analyzer, attributes are also used to visualize a graph as a cluster of nodes for pattern discovery and identifying new knowledge.
2. Capturing Dependency
A Dependency is created between two items of the same category. For example, if you want to connect an application system object with another application system object to show an interface between two application systems. Or to add a dependency to show a capability is dependent upon the completion of another capability. For each link or dependency, it is recommended to capture the type ‘Flow’ to depict what is being exchanged on the link/dependency.
![]()
Viewing Dependency Attributes
When dependency type relationship is added from an object then the dependency icon automatically appears on the object indicating there are dependency type connection. Tap on this icon to visualize the dependency connections in a graph.
In a network graph the flow and transfer of information, money and other resources can be visualized between two connecting nodes. You will learn more about the network graph under ‘Insight Analyzer’ section.
The Visual Editor is your tool for all kind of complex mapping and capturing your stakeholder’s work perspectives.