Customer journey map (aka experience map) is a strategic planning tool that provides a common understanding of:
- how customers are interacting with various touchpoints to reach their goals,
- what is their whole experience and
- what business parts (e.g. journey stages, customer goals & outcomes, needs, services, touchpoints, systems, business processes, people) go into making up those interactions and experiences (e.g. rational and emotional part of the experience).
Customer journeys are beginning-to-end activities (e.g. journey stages/phases) that customers perform to achieve a goal while shopping for a product or service they need through various touchpoints across many channels of your organization. Customers buy experience not the product and often customer experience breaks down because most of the time organizations are organized in functional silos focusing individual touchpoints instead of the complete journey. Customer journey mapping provides an opportunity for business architect and customer experience (CX) professionals to design customer experience consciously from an outside-in perspective with the focus of orchestrating and integrating touchpoints across journey. Customers see one organization rather than a collection of dis-joined products, services, interactions, and touchpoints. Build collaboration capabilities to orchestrate and integrate touchpoints to create the WHOLE experience.
In this post, you will learn all the steps to create a customer journey map quickly. Here are the core steps:
- In Enterprise Evolver (web), an activity object is associated with touchpoint. The activity object can be used to capture customer activities and the activities can be tagged as “Journey Stages”.
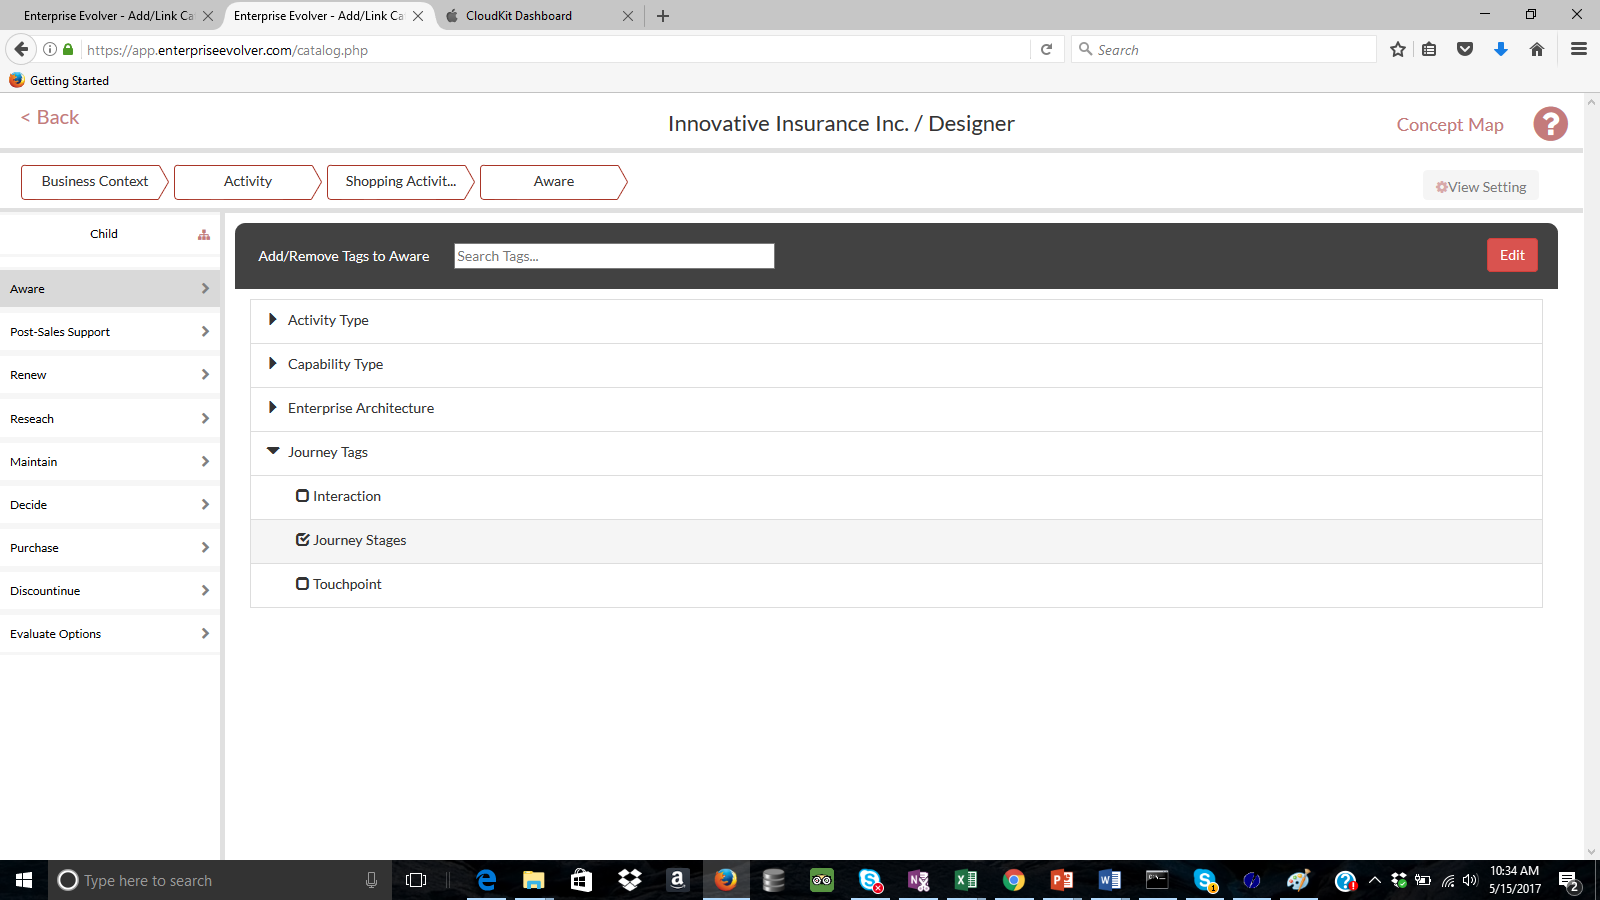
Use Tag features to add “Journey Stage” tag for activities
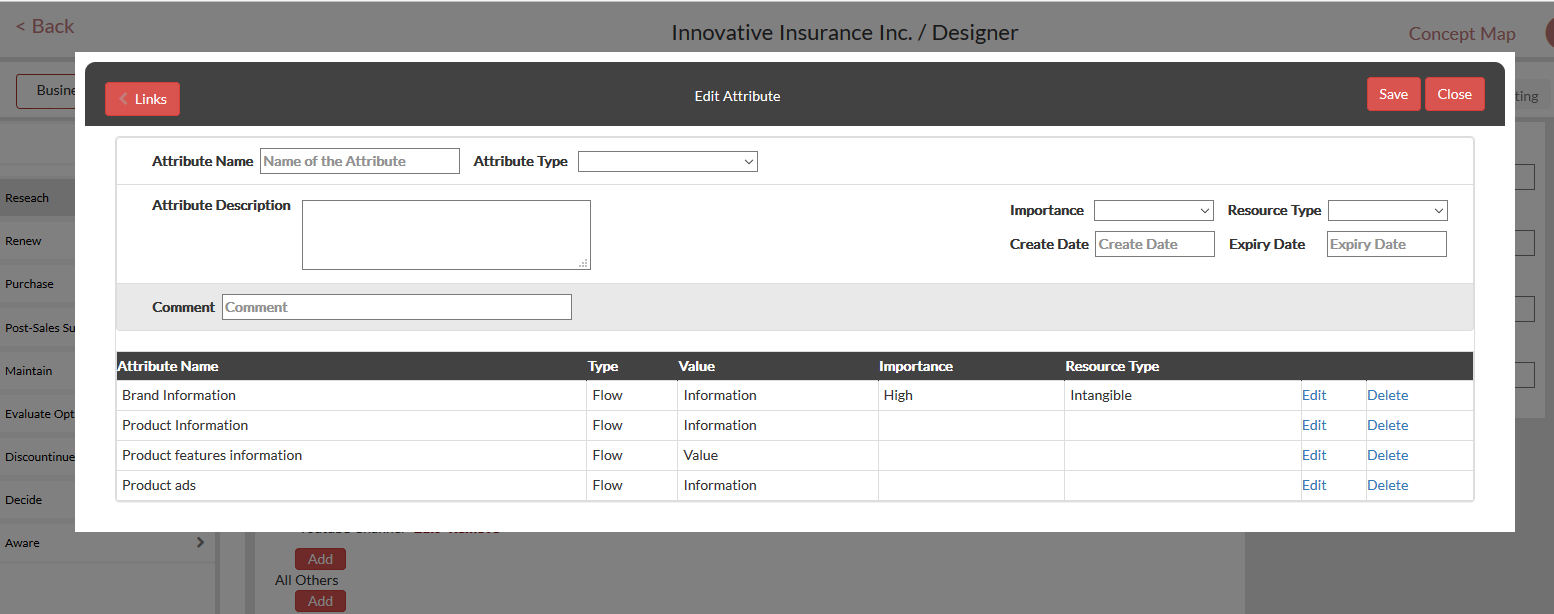
- After you capture your journey stage data, the next steps are to link the journey stages to the touchpoint through which your customers/users access your products/services. You can also capture the information that you display and share (e.g. product information, feature or pricing information ) with your customers/prospects on each touchpoint and for each journey stages. If you want to show this information then make sure you select attribute type ‘Flow’ and attribute value as ‘Information’.
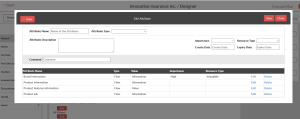 You can also capture what customer does on each of those touchpoints, select attribute type ‘free text’ and enter the value on ‘Attribute value’ field. This extends to what they think and how they feel, as they interact with your brand across multiple touchpoints and/or journey stages. The start date and end date data can be used to capture when the link was established.
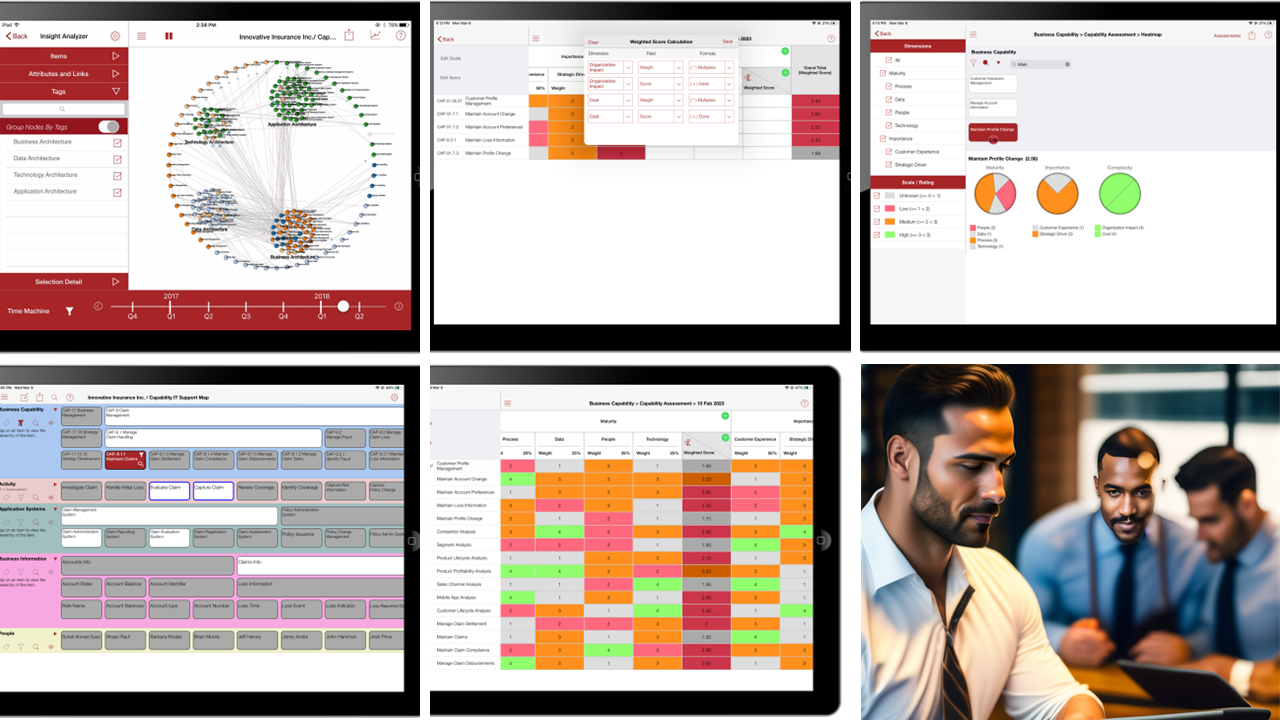
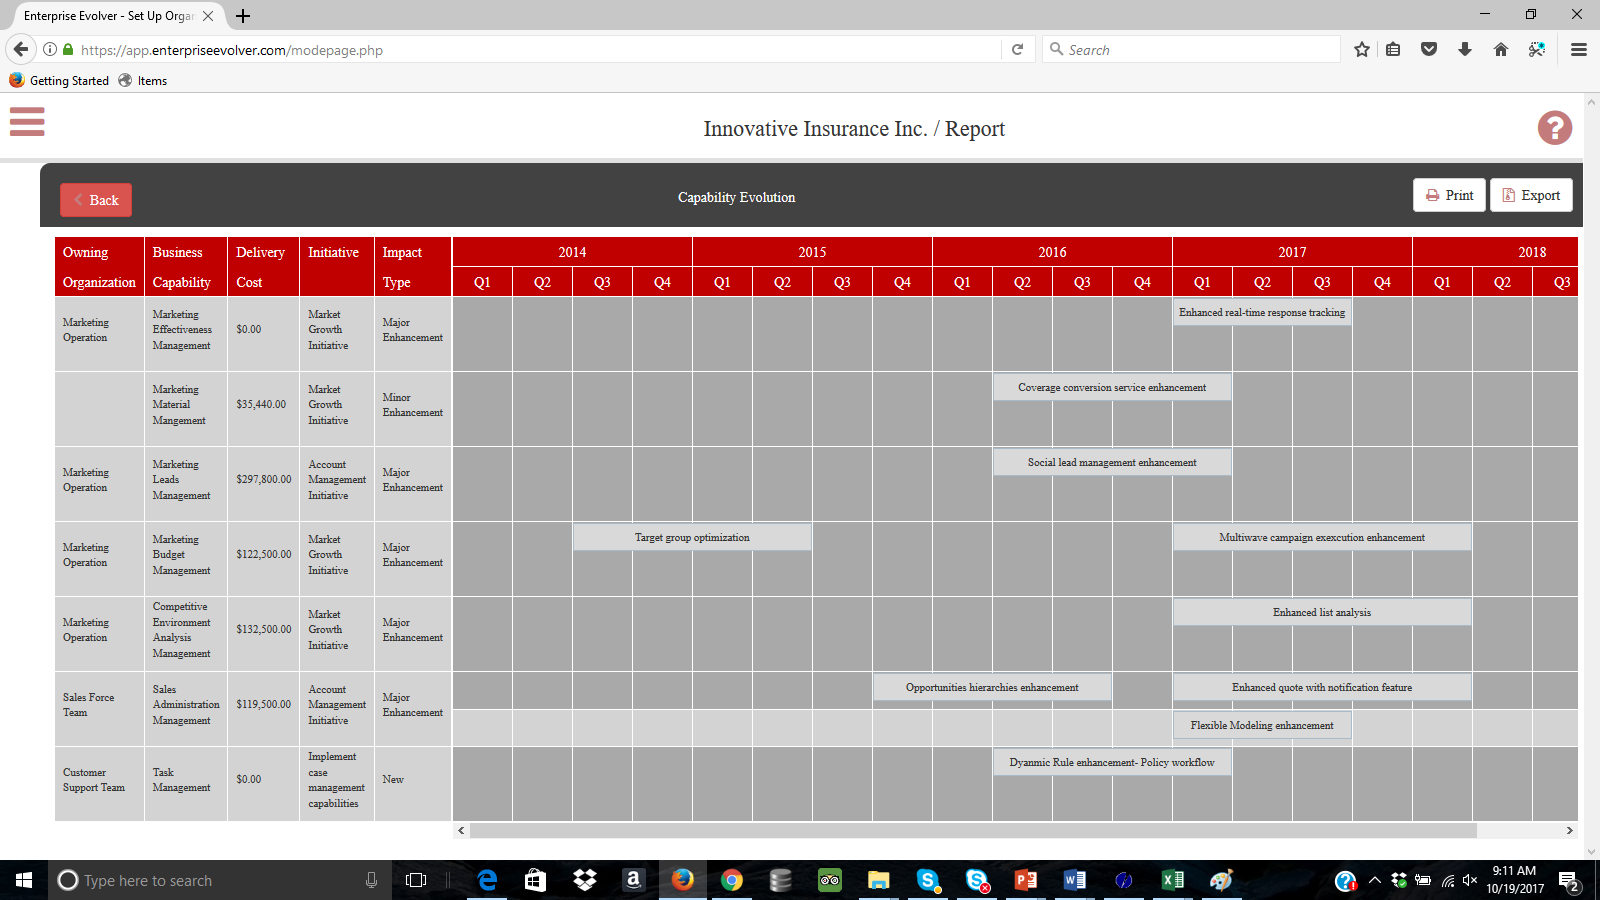
A future date can be also captured. In the Insight Analyser, these dates provide an ability to visualize the journey map evolution & to understand how the customer journey is evolving, what services we are providing and what capabilities and technology enable those services. - Each of these touchpoints can be linked to the service/products that are accessed through these touchpoints. Select the touchpoint and add the link for services. You can select multiple services.
- You can link services to the capabilities that expose those services.
- Use Job object to capture various customer’s scenarios or goals. Capturing jobs helps you to quickly gather customer’s requirements and priorities.
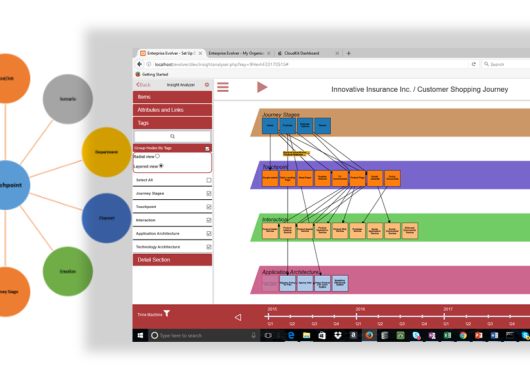
This is a simple way to quickly create a journey map. Make sure you create a new file under the Insight Analyzer and generate the graph. Visualize the graph in the layered view from the Tag option. Your customer journey is ready to be shared with your stakeholder to tell the story of your customer experience. Check out a brief video.