Business and IT professionals know quite too well the importance of having intimate knowledge about the relationship of an enterprise business’s strategy, capability, processes, technology, information systems and other resources and how the organization deals with its resources, capabilities and customers. When working towards success, it is extremely important to understand that those are constantly evolving factors that need to be always watched, perfected, and especially, addressed quickly when they need fine-tuning. This is exactly where apps like Enterprise Evolver shine and excel, ensuring speed and reliability of the work of these professionals, from the creation starting point to the application of concepts and practices, and passing through the middles steps of discussing, sharing and working collaboratively to achieve a full enterprise map.
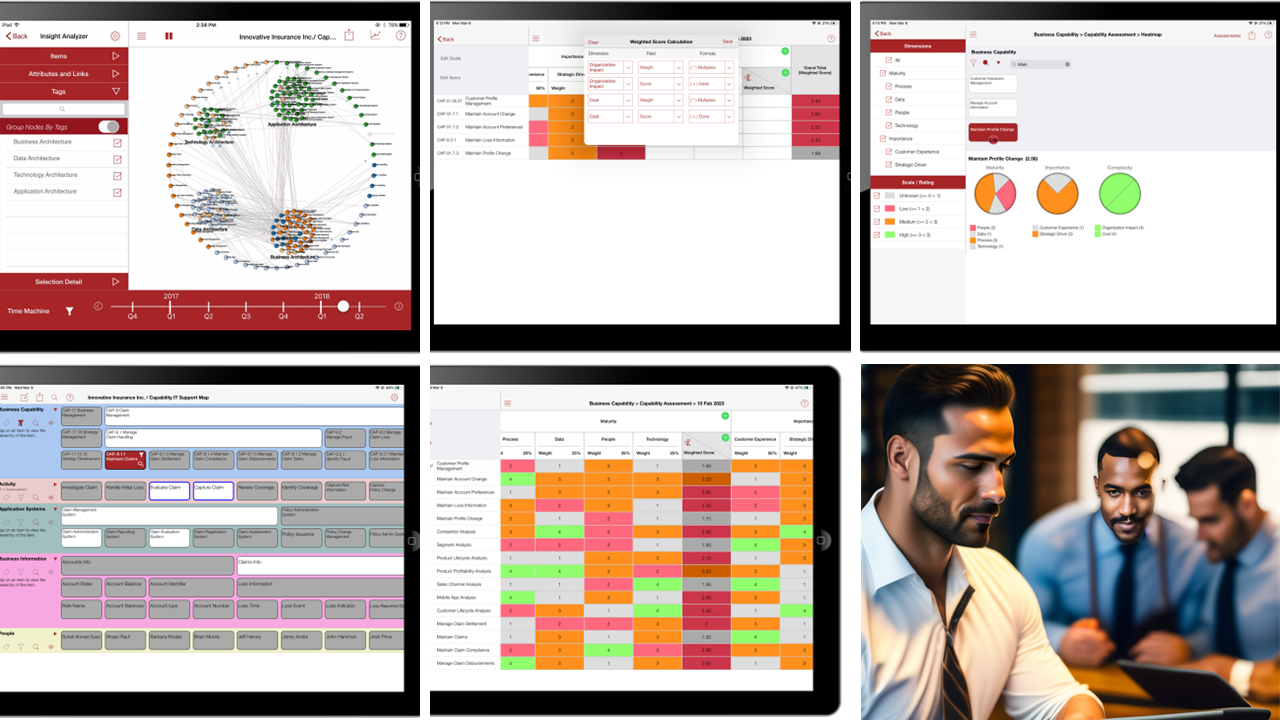
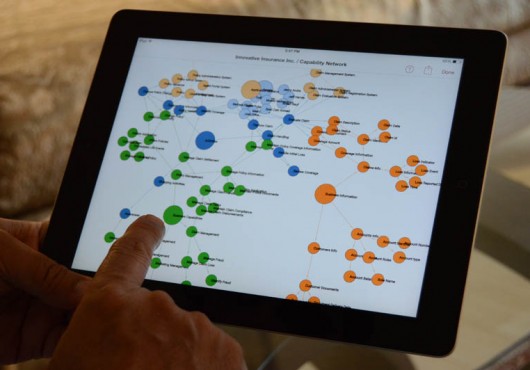
In Enterprise Evolver, you can now map Customer Jobs & Journeys, Business Goals & Strategy, Business Capabilities & Outcomes, Business Processes & People, Technology & Application Systems and understand how all parts of the enterprise fit together and relate to each other to deliver value to your customers. Most importantly, you can visualize your complex enterprise in a network graph on your own iPad.
In the article, “Enterprise Architecture as a Service Graph“, Doug McDavid has said that “Our reality can be mapped as a graph of nodes and edges, where nodes consist of boundaries around identifiable individuals, groups, organizations, enterprises and the like.”. He further suggested that “everything we do, in any kind of working situation, is a form of service.”. Tom Graves in his book “Mapping the Enterprise” also suggested that in a enterprise everything is a service and each of the actors in the enterprise provide those services. But how do you model the enterprise complex relationship as service to visualize the complexity?
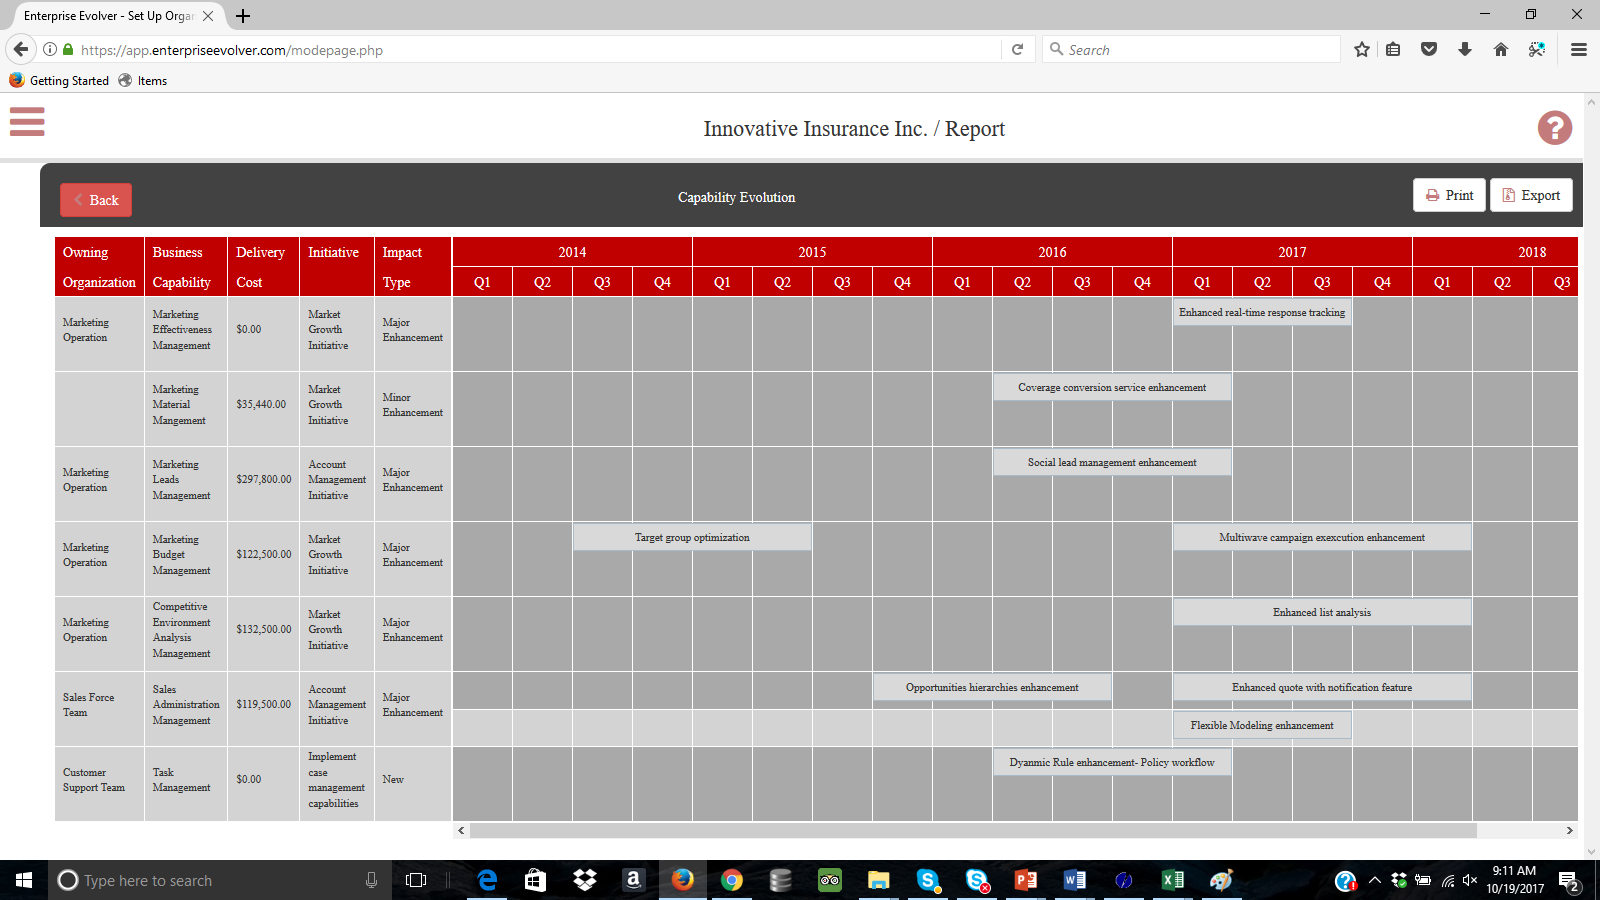
Evolver allows business and IT professionals to map an enterprise’s big picture fast and reliably using a great combination of Maps, Filters, Tags, extendable meta model, graph and a friendly way to navigate it all. The material created with the app can be presented, compared, analyzed and shared. The creation of blueprints, maps and graphs take central stage and one can manage a great deal of map types that help to visualize and understand enterprises fully, ensuring that managers, analysts, architects, designers and consultants develop a deep grasp and appreciation about the goals, operations and capabilities of a business. The data collected via many blueprints can be used in generating various kind of graphs to satisfy the concerns of your stakeholders.
In a brief video below, watch how you can visualize various business parts, their connection and interdependency.
To download from the Apple Store , tap here. For an enterprise license, contact us using this link.