Our application Enterprise Evolver gives you the ability to import, capture, document, visualize and manage organization structure, business capabilities, features, customer journeys and resources (e.g. people, application systems, IT services, technology etc) and map all these interrelated business parts. This makes it easy for you to understand the impact of any change before a strategy is executed. Continually infuse new capabilities or enhance existing capabilities into your business operations.

- Use import feature to quickly capture the inventory of any business part using MS Excel file with few simple step.
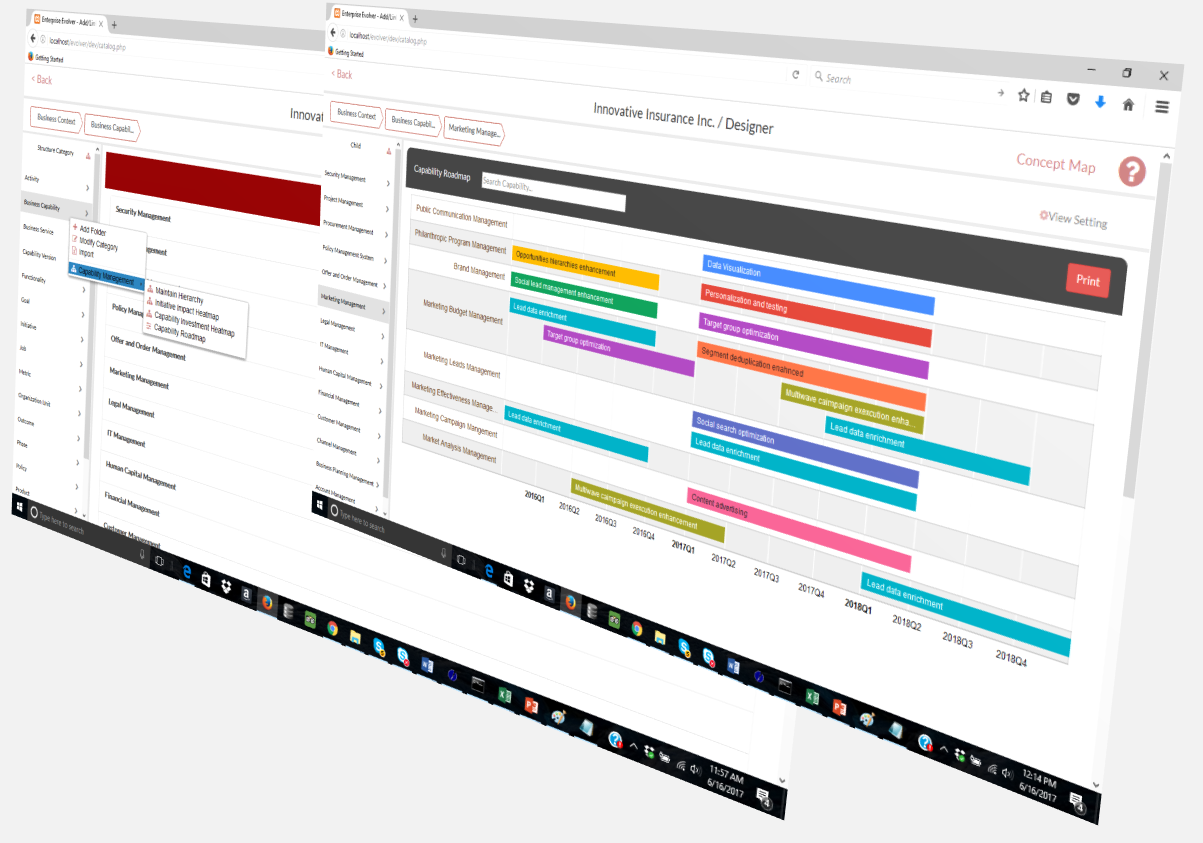
- Perform capability based planning, create capability increments, capture business requirements, allocate resources and generate capability roadmap.
- Use tags to classify architecture information of business parts in a way that is useful for the users and users find what they are looking for.
- Capture your complete enterprise architecture, business capability model, technology model, application inventory and customer journeys and processes.

- Visualize the digital representation of your customer journey and understand how touch points are supporting various journey stages and what products and services are offered through those touchpoints over time.
- Visualize your solution blueprints over time and see how your solution architecture looks like at any given point in time.
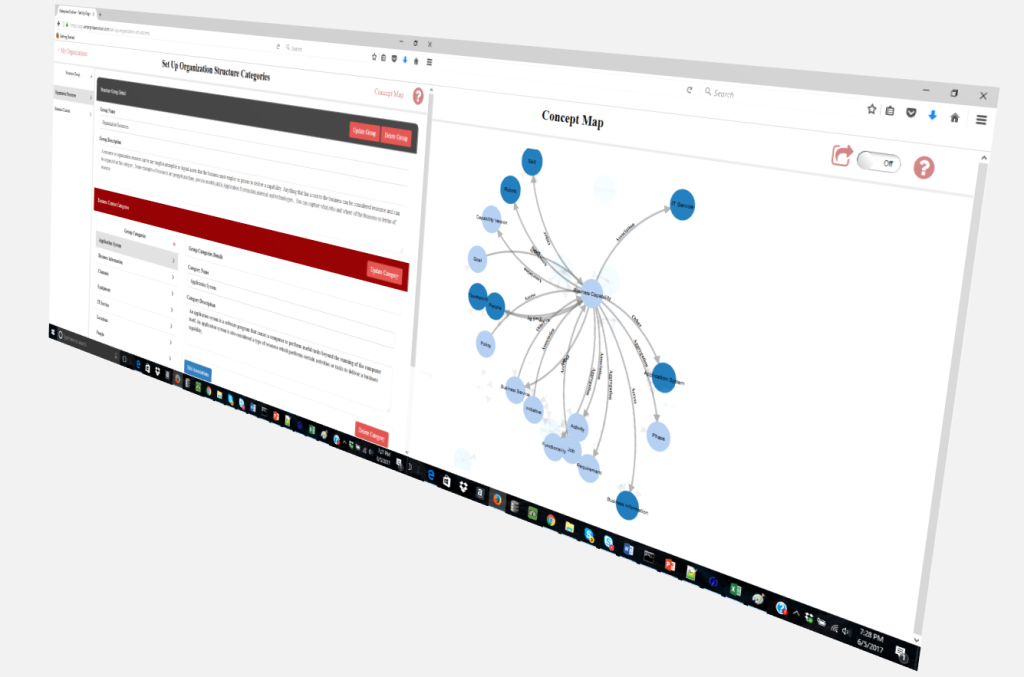
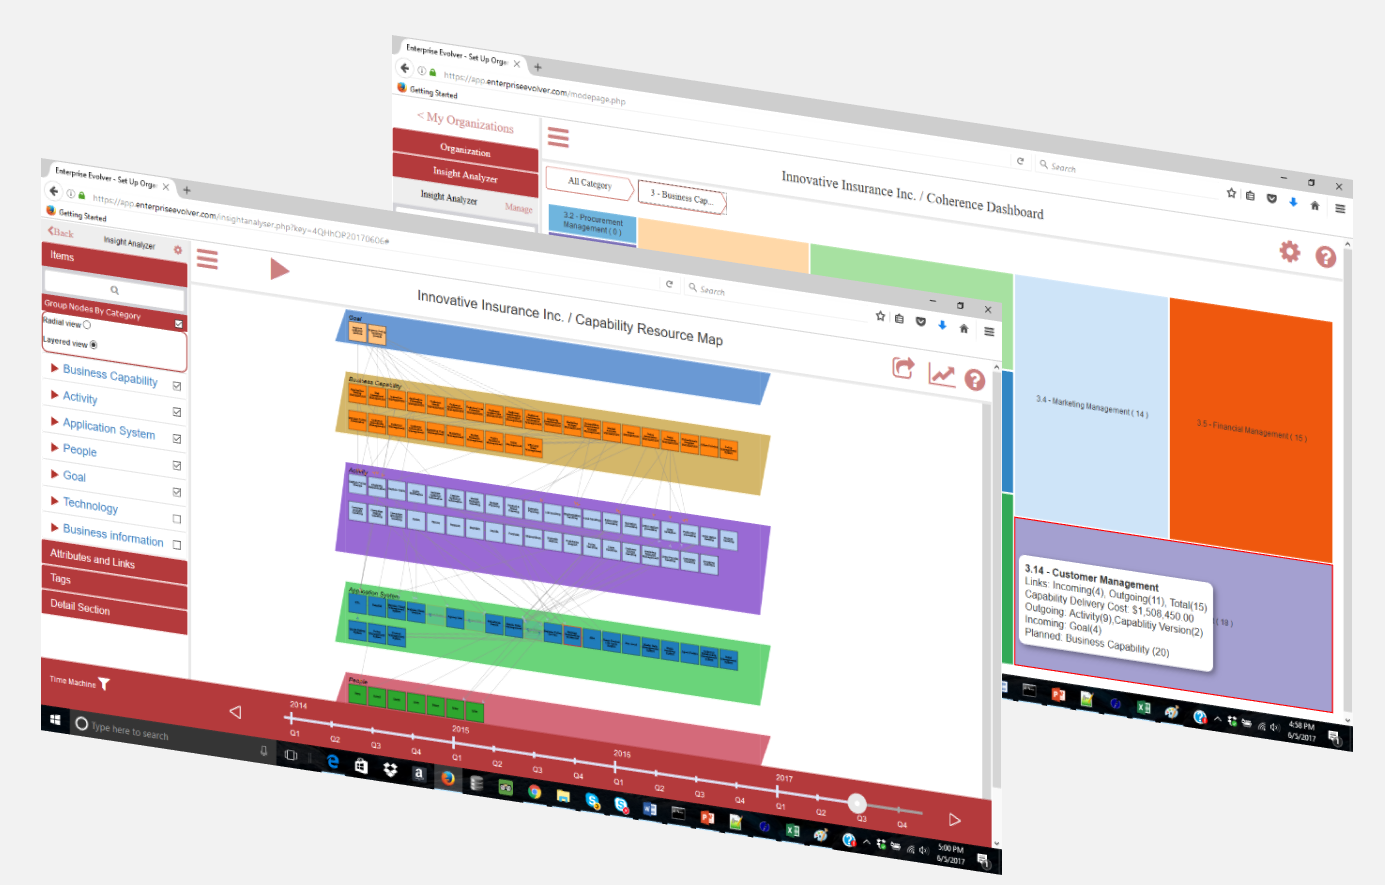
- Capture your enterprise architecture in a network diagram or radial or layered diagram and perform what-if analysis right on the diagram.
- Understand the flow of exchanges between various business parts such as analyzing what information is flowing between application systems and processes.
- Understand your core capabilities and core technology and application systems in the complex network of your business.

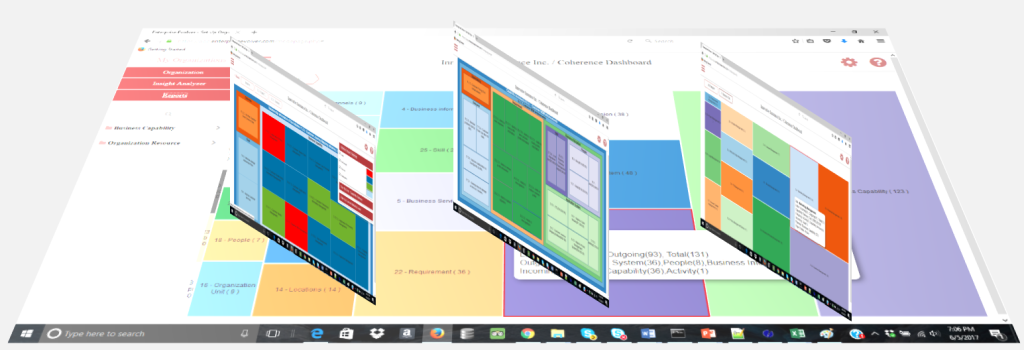
The dashboard consolidates and arranges business parts information such as hierarchy information, incoming, outgoing links/references & dependencies, the cost of resources and capability from one single intuitive interface. Business analysts, product managers, portfolio planners, and architects can all use the dashboard to perform what-if analysis and continuously monitor changes to the business.
- Drill down from capability model to see all its relationships to application systems, people, technology, and other resources.
- Understand what are important capabilities with higher developing cost.
- Understand what skills are most important to support your business operations.
- Plan for better capacity by understanding people allocations to various capabilities.
- Understand the capability development or enhancement cost by each architecture phases or by each initiative.
- Understand how strategy is connected with goals and capabilities to outcomes.
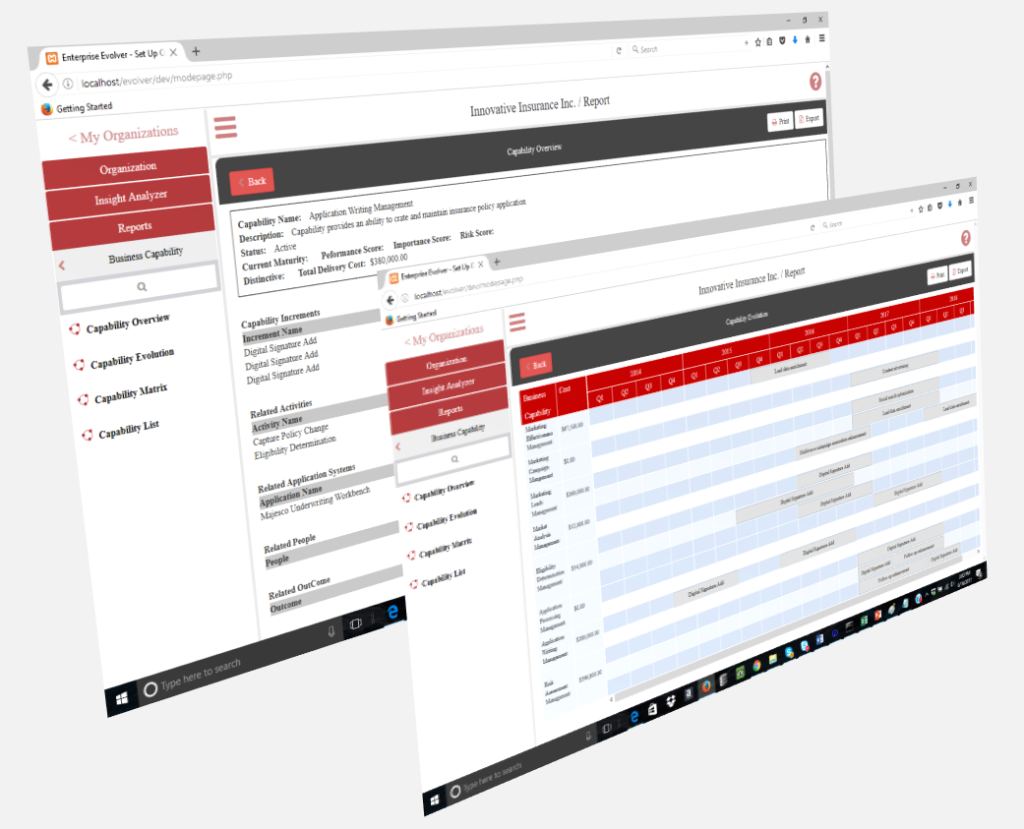

Evolver reports can be used to create reports in PDF/HTML and Word format. Additionally, you can extract data in Excel format for further analysis or use it in your preferred reporting/analytic tools.
- Generate capability overview report to see the 360 view of your capability and its relationship data (eg initiatives, people, outcome, application systems etc).
- Create reports in matrix format to analyze relationships.
- Export hierarchical and relationship data to Excel files.
- Create applications/technologies end of life cycle report and more.
.
Evolver meta-model can be configured and extended to meet your own unique needs.
- Assign new relationship type and add new business catgeory/component.
- Visualize the meta model through an interactive graphical interface.