Change is a constant. Today, change happens faster than ever. Many kinds of initiatives constantly take place to change the organization.
If your organization is complex, visualizing the complexity of your business and understanding the relationship between all business parts and improving capabilities in response
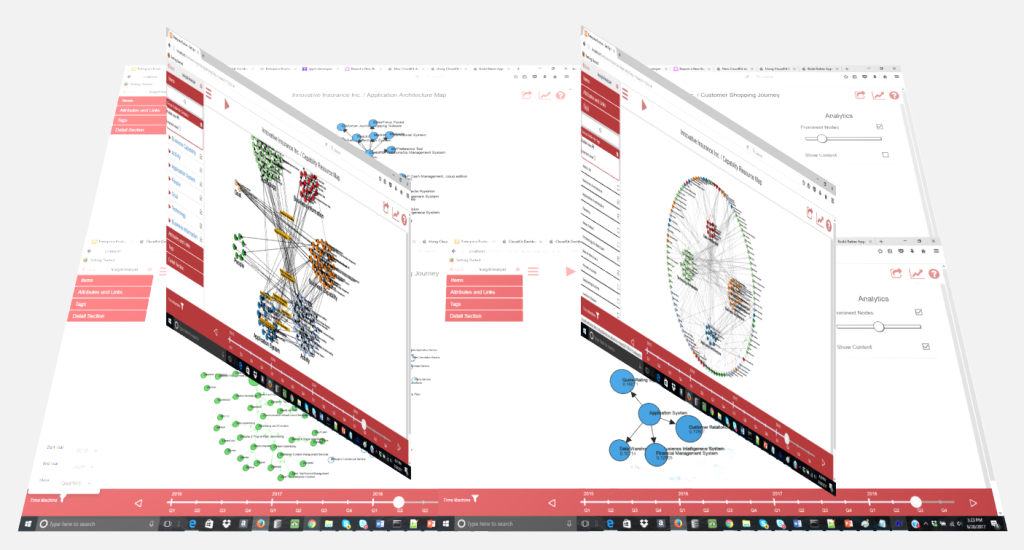
to external pressures is difficult. Evolver’s Insight Analyzer combines analysis and visualization of large relationship data that users can interact with the built-in graph database. Visualize the complexity in many different graph format and see patterns, anomalies, clusters, and relationships.
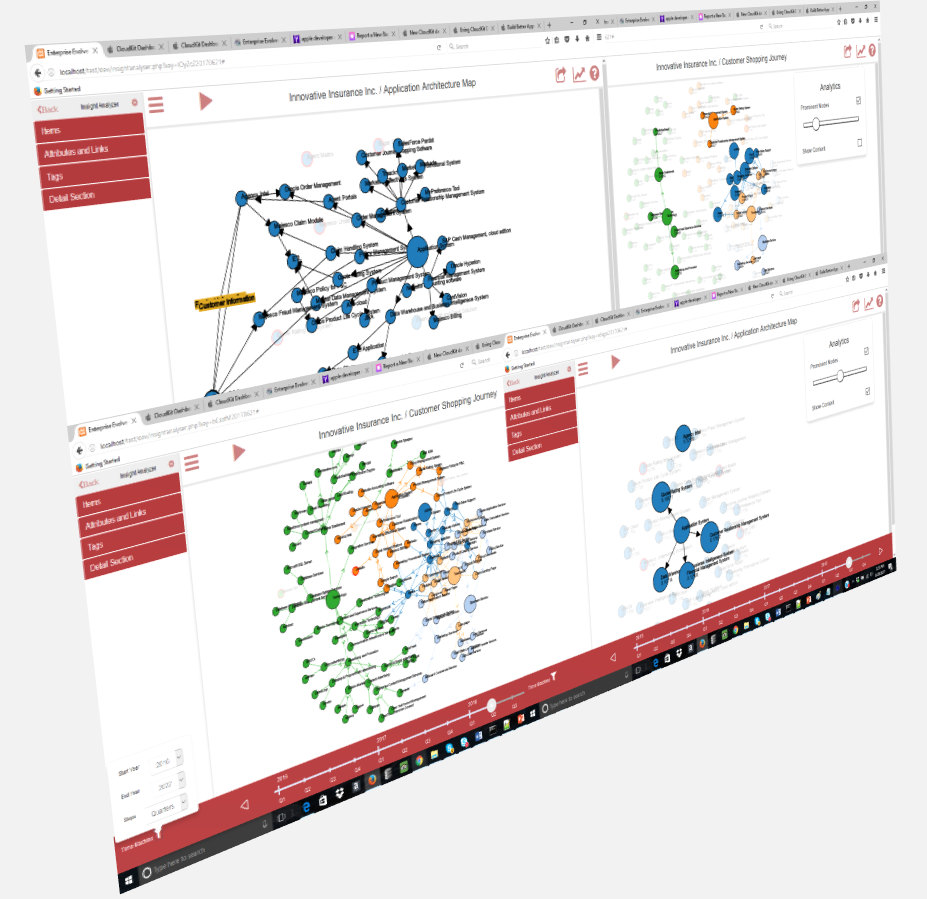
The Insight Analyzer’s interactive network viewer enables users to visualize the complex relationship and enterprise architecture data over time. This helps users to make sense of a large amount of relationship data by looking the content in an interactive visual network format. By visually illustrating the relationship between business parts, the connections between this business parts become more transparent and can lead to further discovery. Graph visualization expands the expressive power of the medium, revealing patterns and connections that put everything in context.
- Represent the essence of your business and IT in a network structure
- Understand structure through attributes, flow and content shared between business parts or systems
- Interact with the relationship and architecture data with few touch and clicks and use filters to visualize the part of the business
- Identify isolated business parts and manage the business risk
- Filter the network and identify patterns
- Create value map, application architecture and system data flow map.
- Zoom in and Zoom out on the data points that you want to use
- Identify prominent applications, products, critical capabilities, and critical dependencies and manage the application and capability portfolio.
- Perform reuse analysis and cut the cost and time to market. Understand the extent of reuse of resources across capabilities and products
- Present architecture data in a PDF format and print the data on a large poster.

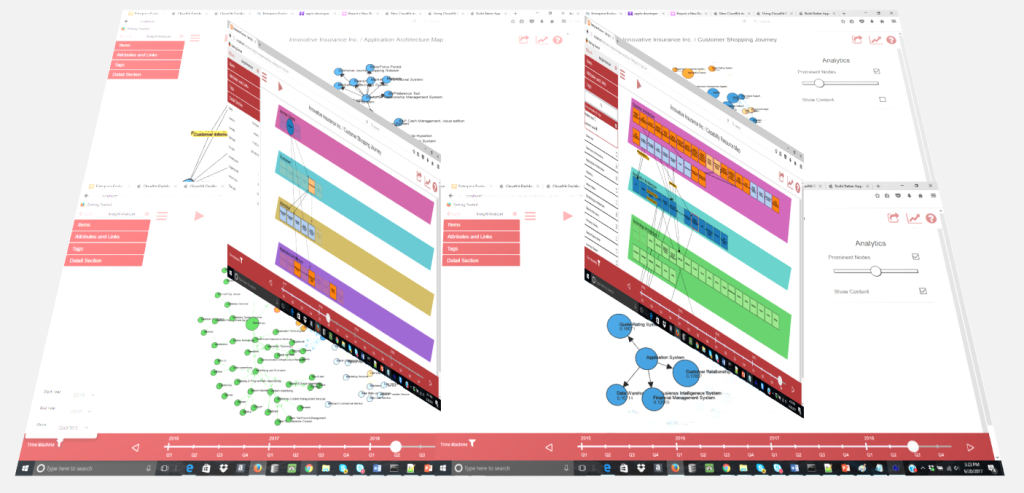
Easily switch from a network view to a layer view to visualize the architecture data in a traditional layered format. Create the time-based interactive layered graph for any situations for any stakeholders.
- Represent your enterprise architecture into a layered architecture and visualize the evolution of your enterprise architecture over time.
- Visualize your customer evolving journeys and perform what-if analysis to understand the relationship between journey stages, touchpoints, products/services and capabilities including backstage processes and technology layer.
- Create an SOA (Service Oriented Architecture) reference architecture or integration architecture visuals.
- Simply represent how business capabilities are supported by resources (eg, people, process, data, application systems )
- Visualize how business capabilities are decomposed in capability increments and capability increments into product features.
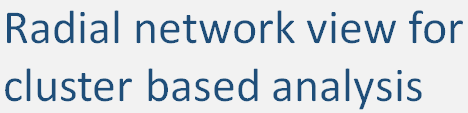
Switch to the radial view from a complex network view to identify groups of nodes or business parts as a cluster and discover patterns between clusters.
- Understand how groups are connected to one another compared to the network as a whole.
- Identify complex and dense groups and visualize the pattern of flow of information or value.
- Visualize your enterprise architecture as clusters of business architecture, technology architecture, application architecture and data architecture and understand the relationships between various architecture components
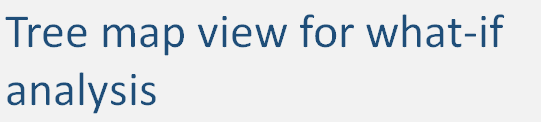
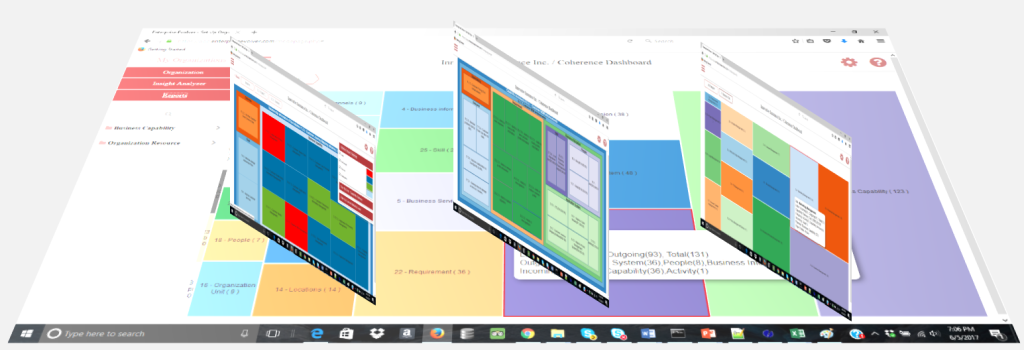
The dashboard consolidates and arranges business parts information such as hierarchy information, incoming, outgoing links/references & dependencies, the cost of resources and capability from one single intuitive tree map interface. Business analysts, product managers, portfolio planners, and architects can all use the dashboard to perform what-if analysis.
- Drill down from capability model to see all its relationships from application systems, people, technology, and other resources
- Understand what are important capabilities with higher developing cost.
- Understand what skills are most important to support your business operations
- Plan for better capacity by understanding people allocations to various capabilities
- Understand the capability development or enhancement cost by each architecture phases or by each initiative
- Understand how strategy is connected with goals and capabilities to outcomes