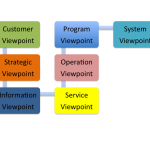
Enterprise Evolver offers an ability to connect, associate and link various business parts (categories). Association can describe the nature of connection/link between various business parts/categories; how they relate to one another; how they interface; how they facilitate the flow and transfer of data, information, money and other resources. For example a customer buys product is a relationship, application systems support capabilities is another relationship. A person can be a member of an organization unit and may be performing business activities, in this case associations can be defined between person and organization unit and person and activity. Further associations can be used by architects and analysts or users to define different views of an enterprise using Insight Analyzer and, therefore, gain deep insights into the business performance and structure from various stakeholder’s perspectives. The Insight Analyzer can be used to create produce many different views or blueprints such as a capability view, an activity view, a resource view, or an process activity view or a view of whole enterprise “the big picture”.
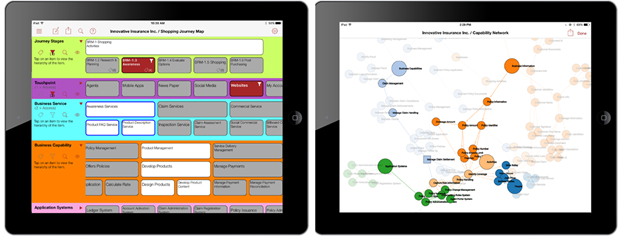
An architecture blueprint or view of an enterprise provides a common understanding of the enterprise that the decisions makers can use to understand how various parts (e.g. People, Process, Capability, Knowledge, Data , Technology & Customers) of an enterprise are related and fit together to deliver value and generate revenue. With Evolver, you create intelligent multi-dimensional blueprints with all the details for decision making. The Evolver automatically generate interactive visualizations from the imported data or data created via the modeling editors. Use the interactive visualizations to navigate and explore dependencies across your capabilities or systems or processes. There is no flipping back and forth between your blueprints and maps and separate documents or spreadsheets. The powerful visual tool in Enterprise Evolver with a great combination of analytical options Filters, Tags, search capabilities deliver all the details you need to effectively analyze and manage business transformation and change. A blueprint that can be used to perform what-if analysis and to understand enterprise complexity which is accessible anywhere employees may be, with an engaging, intuitive user experience. Some applications where Insight Analyzer would be a handy tools are follows:
- Criticality . Many links incoming and outgoing from a node to another nodes provides an understanding of how critical is a particular resource or capability to the enterprise. They represent the highest priority for improvement or investment considerations.
- Redundancies. The same capability may be implemented by multiple application systems. Or deducting redundant capabilities by more than one project by mapping projects (or initiatives) to capabilities.
- Overlaps. Some application systems may implement multiple capabilities or portions of capabilities. It is common to have both redundancies and overlaps.
- Gaps. Capabilities that have been identified as necessary to meet (new) business requirements do not yet exist.
- Pain Points. Customer pain points showing the journey through the different touchpoints that characterize customer’s interactions.
- Isolated Parts. Identify isolated instances of business parts which are not linked to any other instances of business part and identify business risks.
- Outsourcing. Understand the impact of outsourcing a resource or process precisely what gets outsourced and identify undesirable consequences. Identify better candidate for outsourcing
- Reuse. Identify where resources can be reused or reused across the enterprise , for example understanding the degree of reuse of a material or person among business activities.
- Risk Analysis. Understand the impact of a resource failure, for example if a machine fails, what processes and ultimately what final products will be impacted? What processes, customers and application systems will be impacted if a person leaves the company?
- Value driver analysis. Understand most important factors influencing a selected KPI, i.e. identify the application systems, people, activities, services or products directly related to the KPI.
The Evolver offers two ways to analyze & visualize the complexity of the enterprise: layer based and network graph based to provide a complete view of dependencies. 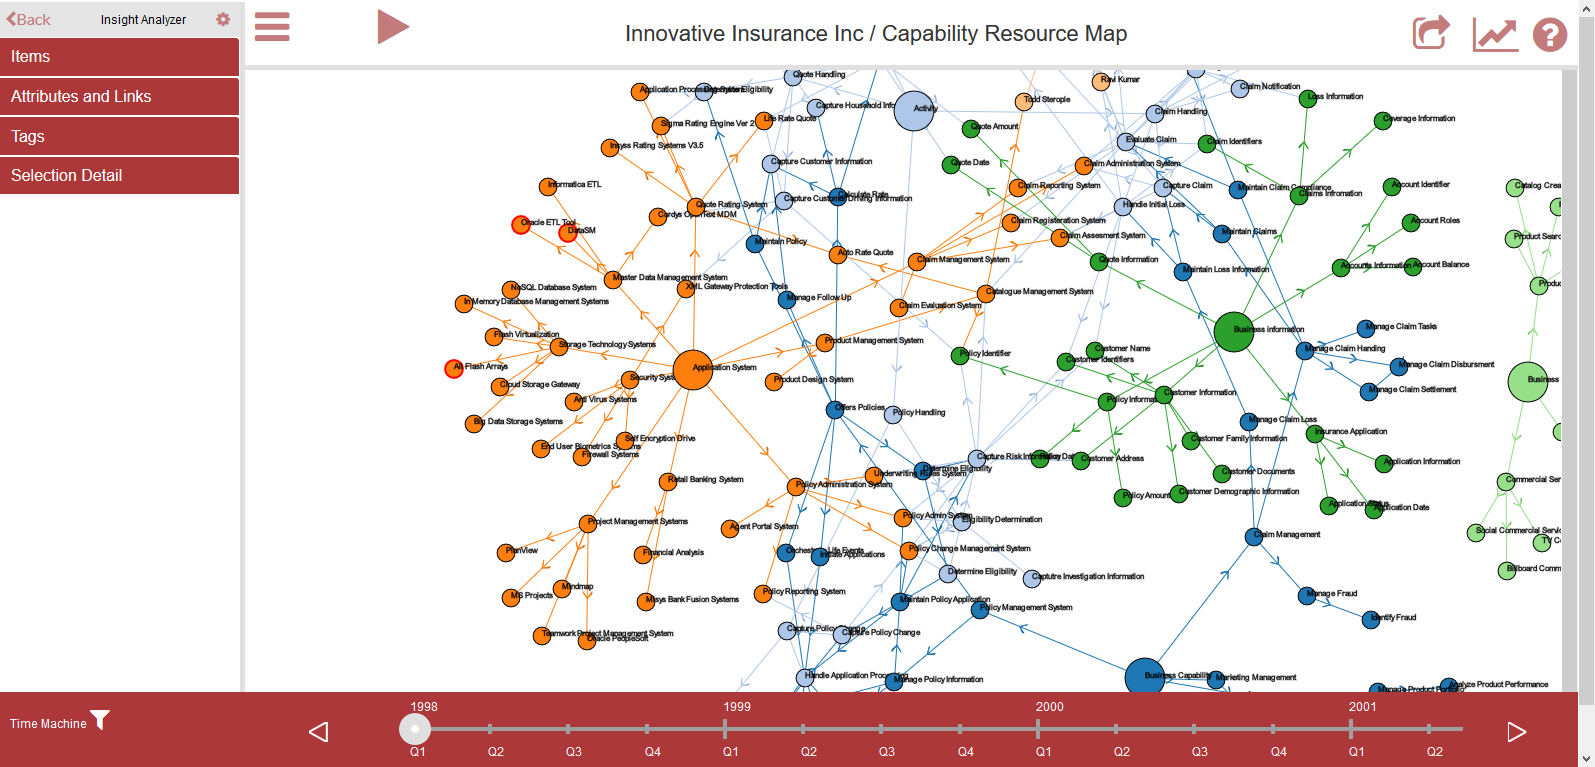
Want to learn more?
Watch this short video.
 Architect
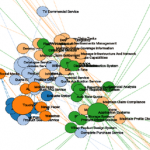 Insight
 Share
Share