The Covid-19 crisis is forcing companies to deploy their resources to support critical and most important applications. Companies maintain many applications, that are redundant, costly to maintain and provide very little value to the business. In the time of such crisis, it is important for businesses to quickly identify most critical and important application systems.
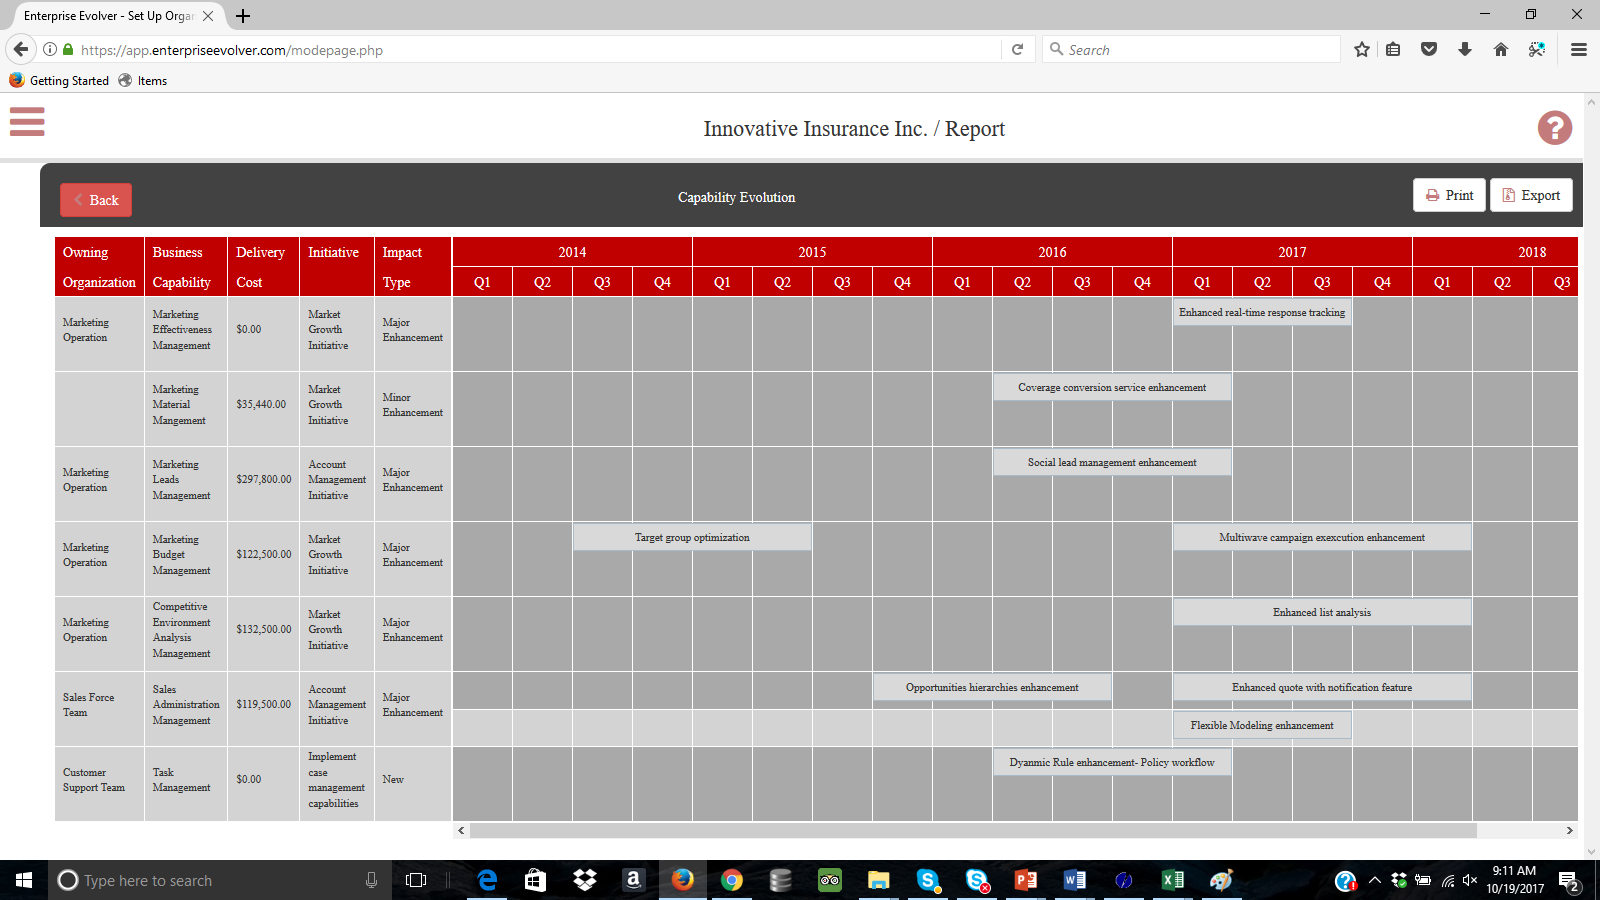
Enterprise Evolver provides many of the application portfolio analysis features such as:
- Catalog applications in a logical and searchable fashion
- Import applications inventory quickly using a preexisting excel template
- Capture application interfaces and connections
- Perform application and
- Create application roadmap
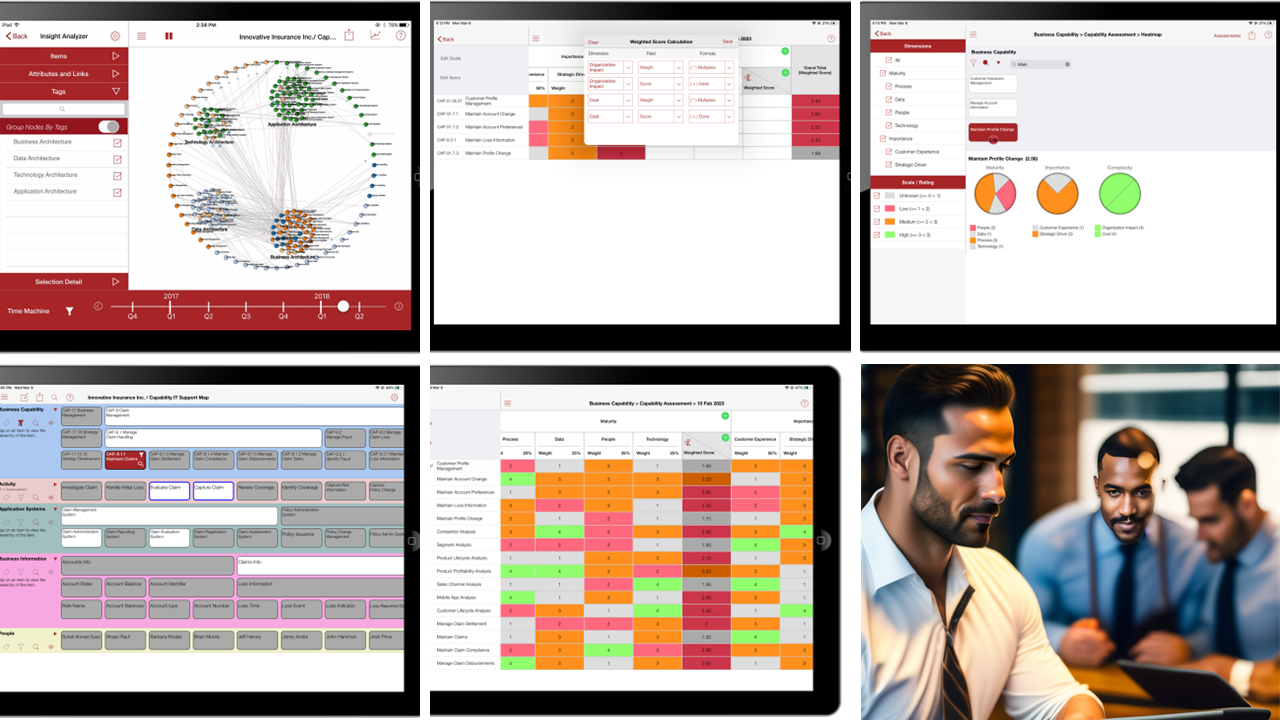
While many portfolio management software may be offering above capabilities, Enterprise Evolver also offers a very unique capability to identify critical applications from the data captured in the repository automatically. This feature is called node centrality which is accessible from the Insight Analyzer module. The Insight Analyzer uses graph theory to generate architecture graphs. In graph theory and network analysis, the centrality identifies the most important vertices within the graph. Centrality gives an estimation on how important a node or edge is for the connectivity or the information flow of the network . The centrality feature can be used from the Analytics icon ( see the figure below). Degree centrality assigns an importance score based simply on the number of links held by each application. The higher centrality indicates that the application system is very important and critical. In the following graph, for each important and critical application node, a centrality number is assigned by the system. The higher centrality number indicates the degree of importance of the application.

This is a very simple feature that you can use quickly to identify critical applications in your portfolio in the time of crisis so that people can be deployed from non critical applications to critical and important applications.


