


In order to make the work of enterprise architecture visible yet not ugly and without creating diagrams of immense complexity, we need to understand that the tool must offer a way to create views, models, and as well as the big picture to support ad-hoc analysis without much complexity. Architecture views or models only offer a partial glimpse of an enterprise reality because it lacks a sense of architecture continuum and hence can’t alone be used for all kinds of analysis and pattern discovery. It misses the ‘Big Picture. The views and models cover specific stakeholders’ work perspectives because different views make sense to different people. As long as it’s just a view addressing a particular stakeholder, the view provides a useful insight to the stakeholder but it does not represent the whole or big picture. On the other hand, the ‘Big Picture could alone be not sufficient because it lacks the detail to generate insight. The ‘Big Picture must be able to offer an ability to drill down to any architecture layer or must be derived by connecting many views.
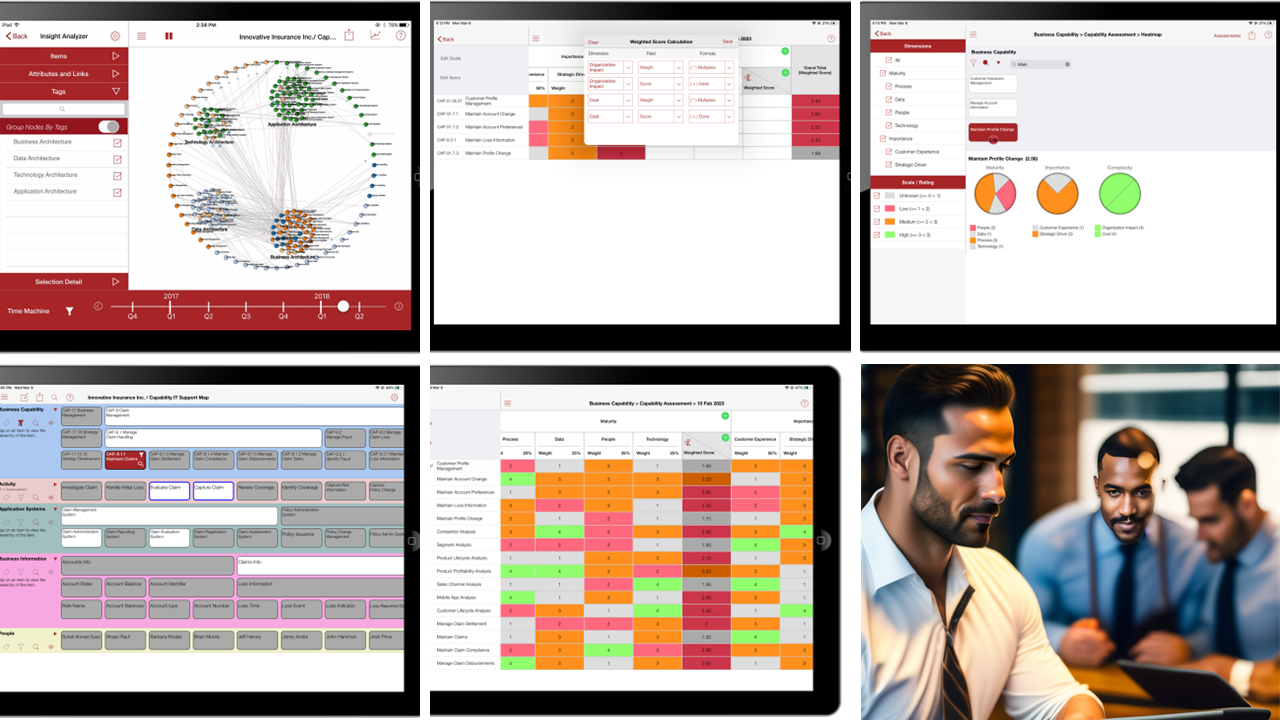
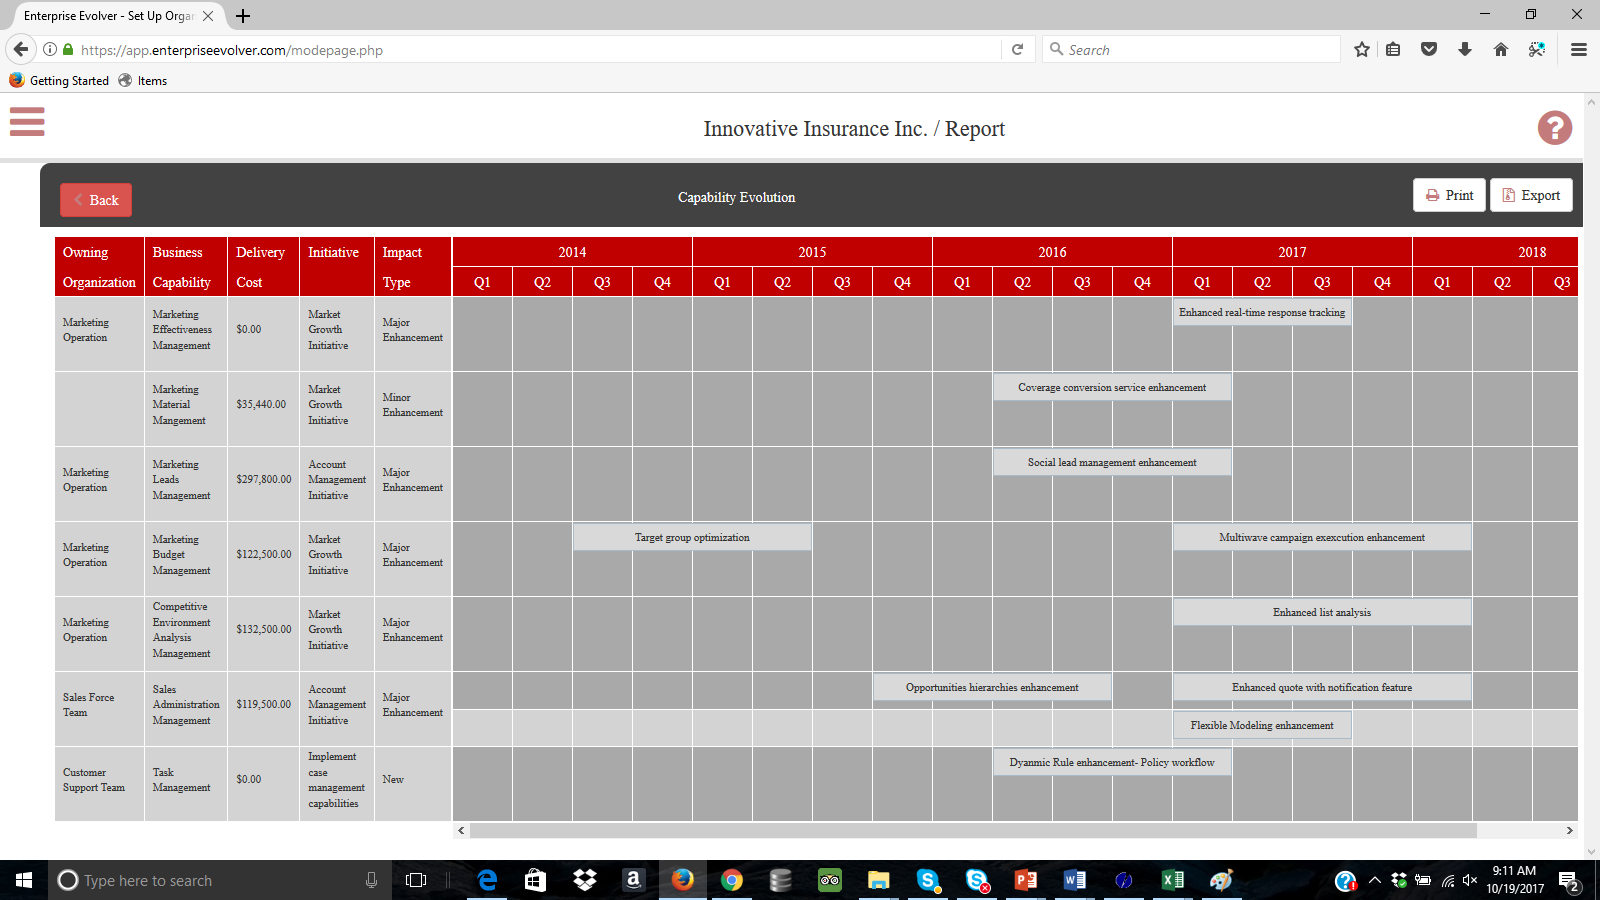
In Enterprise Evolver you create views and models from stakeholders’ work perspectives using the powerful Visual Editor. The Insight Analyzer module of Enterprise Evolver turns the underlying architecture data captured via the Visual Editor automatically into the Big Picture providing an overview that covers multiple architecture layers and provides an ability to uncover emergent patterns and understand the cost of complexity. Most importantly, it generates dynamic views to support ad-hoc analysis.
In Enterprise Evolver, while we do support many built-in architecture viewpoints (e.g, customer viewpoint, capability/strategy viewpoints, operational viewpoint etc), our focus is on total visualization. we use a network graph a visualization technique to illustrate the Big Picture. Enterprise Architects can use the Maps feature to create many views which then can be used for total visualization in a network graph.
Our visualization techniques can be seen as the combination of graphical elements ( e.g. circles, squares, or lines), some visual attributes (e.g. color & size ), a set of supported interactive operations (e.g. physics simulation, filter and search, and layout toggling) and connection and flow modeling to map the various architecture concepts (e.g strategy, capability, activity, systems, data, people, and technology) to visualize enterprise evolution from multi-dimensional data perspective.
Version 3.0 of Enterprise Evolver with a powerful time machine feature to visualize the evolution of your enterprise and the radial layout feature to identify the patterns and meanings in your architecture data will make you a smarter Enterprise/Business Architect.
Watch this brief video to learn about the new features.
You may also be interested in watching this video to learn how to create views and models using the Visual Editor.
Simple and Easy solution for the complex problem!
Visit our website, https://www.enterpriseevolver.com to learn more and download the app today! For an enterprise license, contact us at this link.
Download the app on your iPad from this link .

https://shorturl.fm/JOS10
https://shorturl.fm/0g8tg
https://shorturl.fm/fIcwR
https://shorturl.fm/339X0
https://shorturl.fm/jLf7k
Your point of view caught my eye and was very interesting. Thanks. I have a question for you.
Thank you for your sharing. I am worried that I lack creative ideas. It is your article that makes me full of hope. Thank you. But, I have a question, can you help me?
https://pesnimp3.net
https://shorturl.fm/skjEa
https://shorturl.fm/u3dA2
https://shorturl.fm/xOrKU
Новинки музыки 2026 скачать бесплатно https://shorturl.fm/pj0rJ
https://shorturl.fm/n8lW3
Thanks for sharing. I read many of your blog posts, cool, your blog is very good.
https://shorturl.fm/qd4Tq
https://shorturl.fm/ntNU3
https://shorturl.fm/4OuSl
https://shorturl.fm/U2MwV
https://shorturl.fm/1ItVS
https://shorturl.fm/4gvmw
https://shorturl.fm/KNSom