

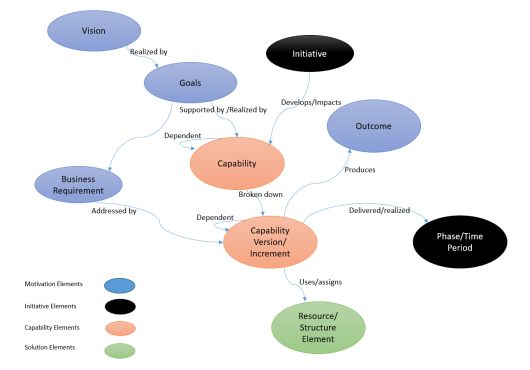
Coherence means something that is perfectly organized in which all the different parts of the enterprise fit together to meet the enterprise desired results. The Coherence Dashboard feature introduced in the latest browser version of Enterprise Evolver could help you to see how all relevant aspects of an enterprise are connected in building a coherent enterprise.
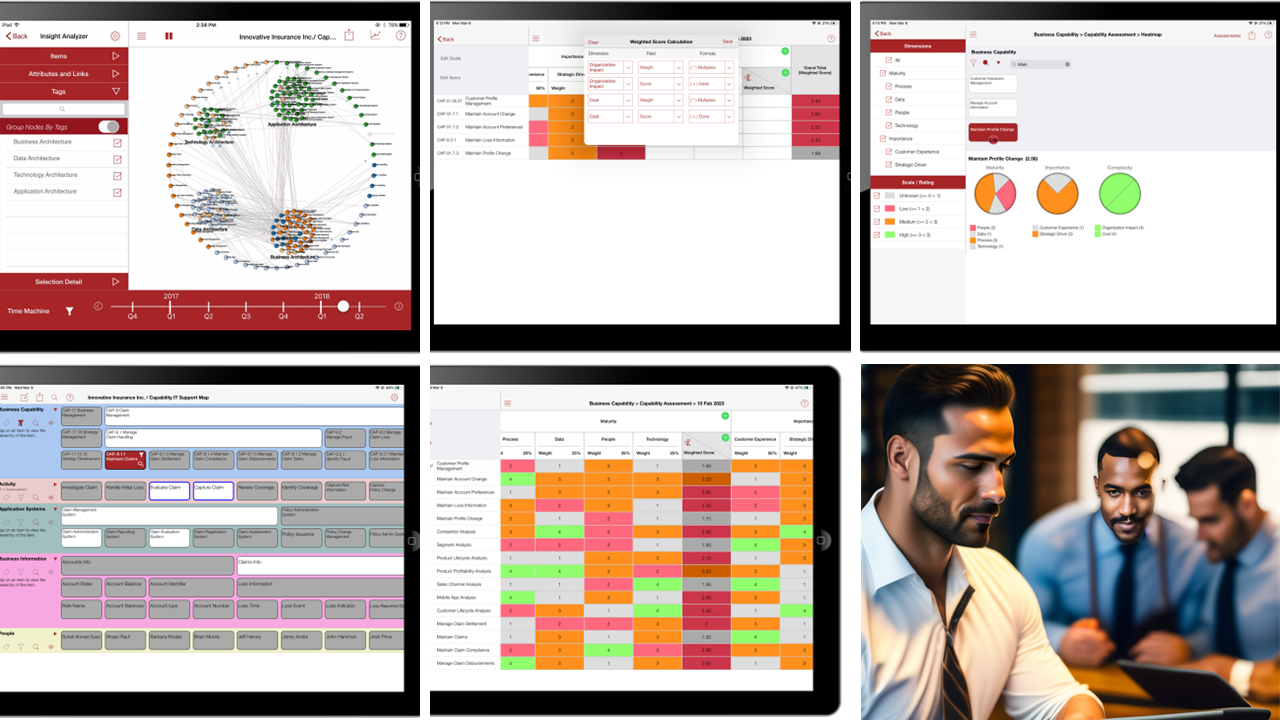
Enterprise Evolver now offers a dashboard feature “Coherence Dashboard” for the web/browser version. The Coherence Dashboard (“Dashboard”) automatically generates a visualization based on the hierarchical and relationship data captured through the Configurator feature. It displays the current status of structural data relevant to the enterprise. In an organization, the size of the boxes (e.g. size of the business parts) and the connection between the boxes will keep changing in response to the external environment and real world pressure. The dashboard holds all the changes and connection together. The Dashboard is the place to visualize many viewpoints such as:
- Capability motivation viewpoint that focuses on the relationship between business capability and business strategy
- Capability model viewpoint that focuses on the capability decomposition to the lower level capabilities and capability dependency data including capability development cost
- Capability increment viewpoint that focuses on the decomposition of business capabilities into various capability versions/increments
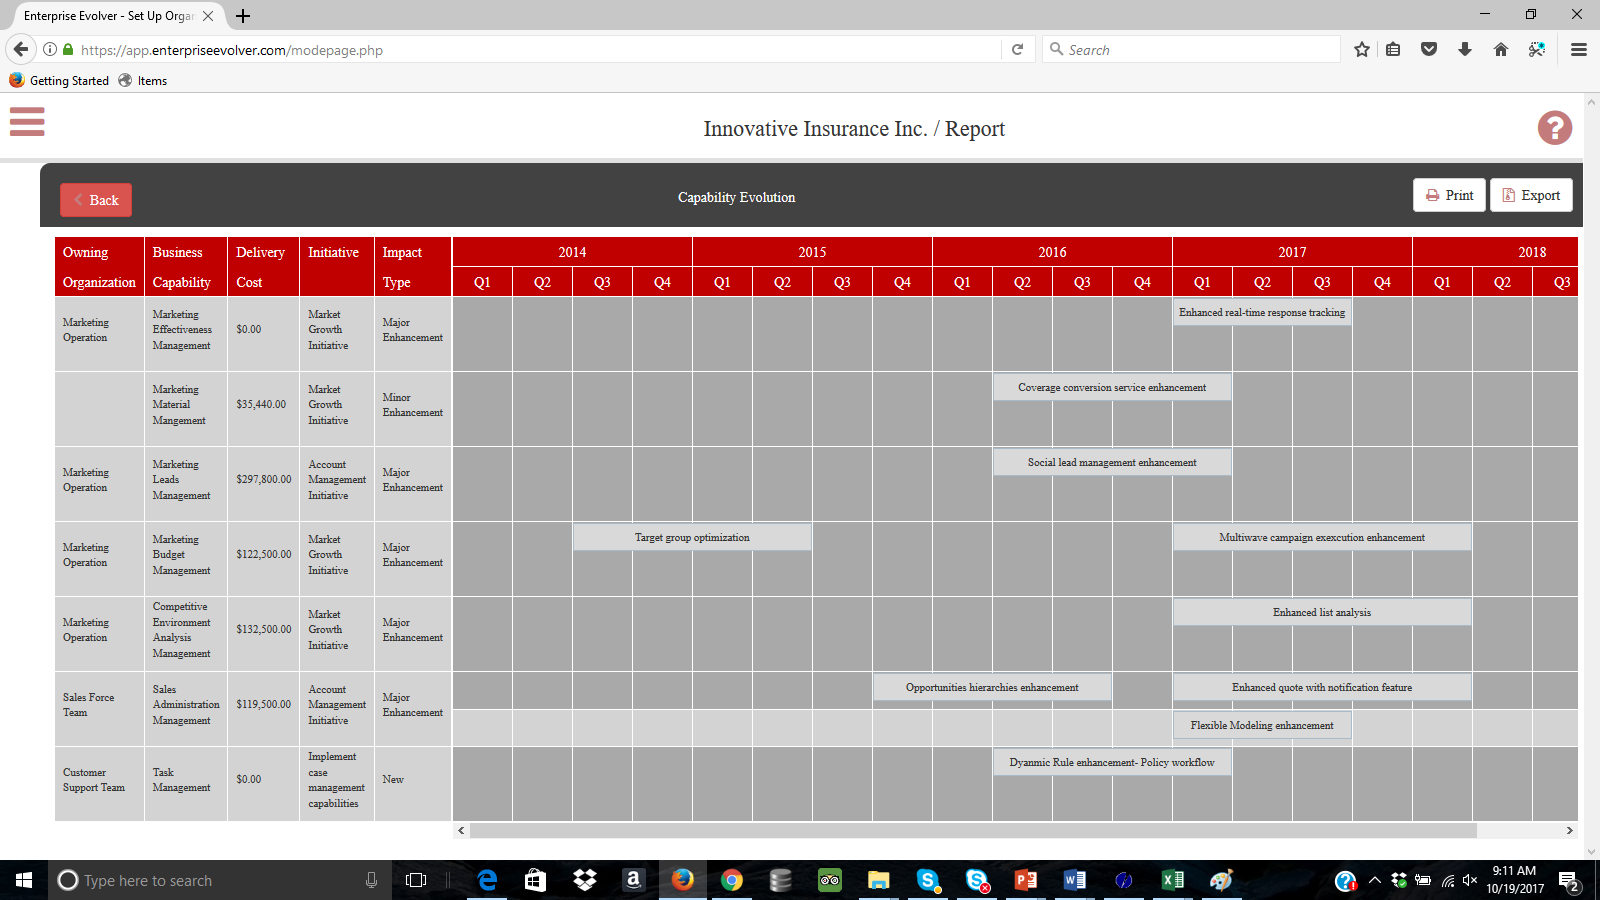
- Initiative viewpoint that focuses on the relationship between initiative, capability and resource allocation to capabilities
- Capability assessment viewpoint that focuses on the capability maturity and capability gaps
- Resource viewpoint that focuses on the resource decomposition and its relation to business capability
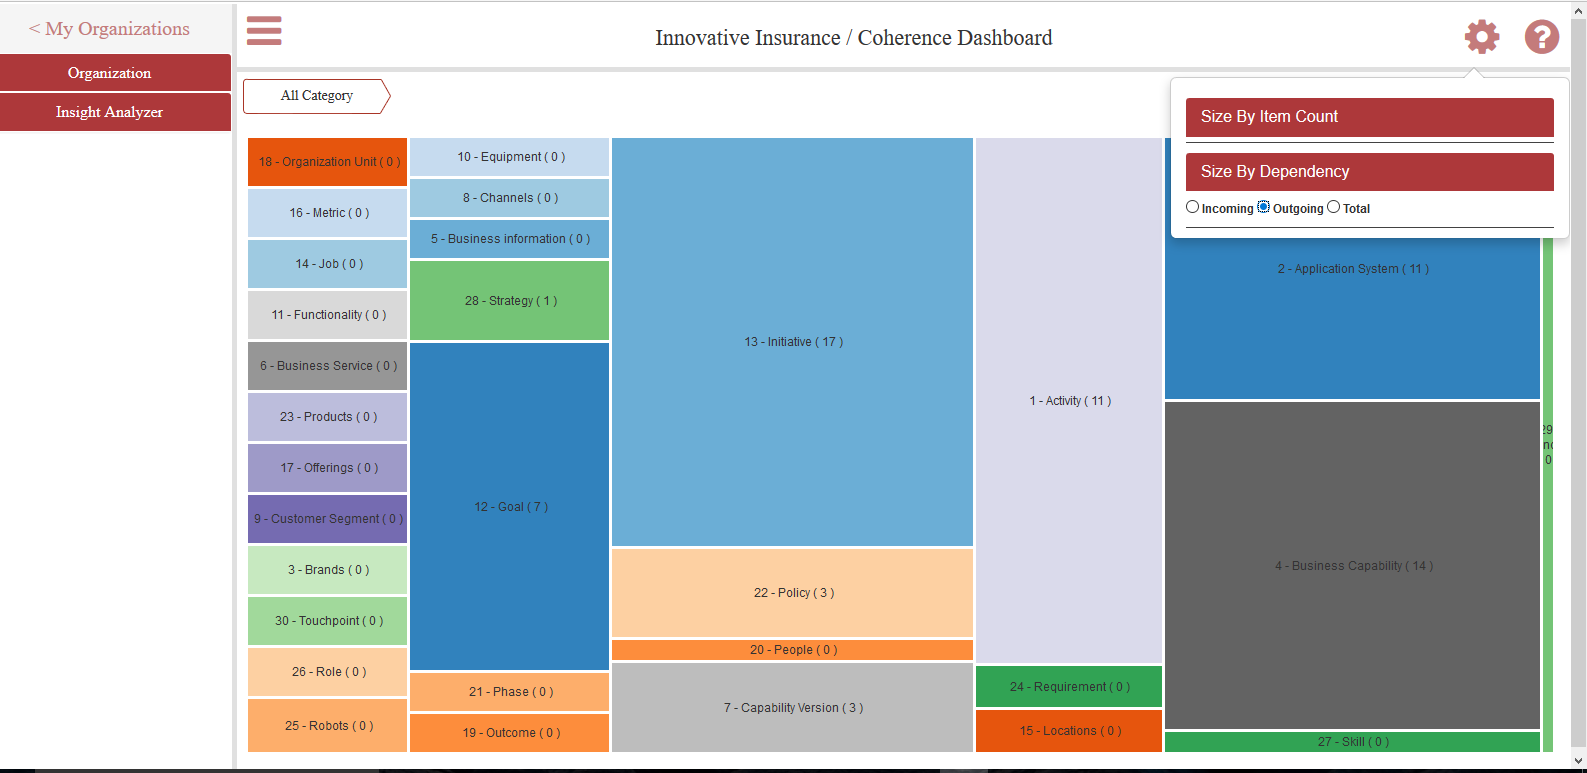
Coherence Dashboard- Box Sizes
The Dashboard map automatically assigns a unique color to each box. By clicking on a category, you can go to it’s leaf node, essentially examining a tree of any business part of the enterprise. Then from the leaf node (lowest level), you can also drill down to the relationship data (all links) browsing all the connections and interconnections. The boxes size is determined by the amount of incoming links or outgoing links or total links or by the cost of resources and capabilities. When the incoming link option is selected, the larger box indicates that there are more other business parts depend on it. When the outgoing link option is selected, the larger box indicates that the selected box depends more on other business parts. The larger the box, the more it is important and more the dependency and complexity. The larger box also represents the highest priority for improvement or investment considerations.
Visualize what initiatives are impacting what capabilities and what are the cost of impact and what capability maturity will be achieved with the impacts.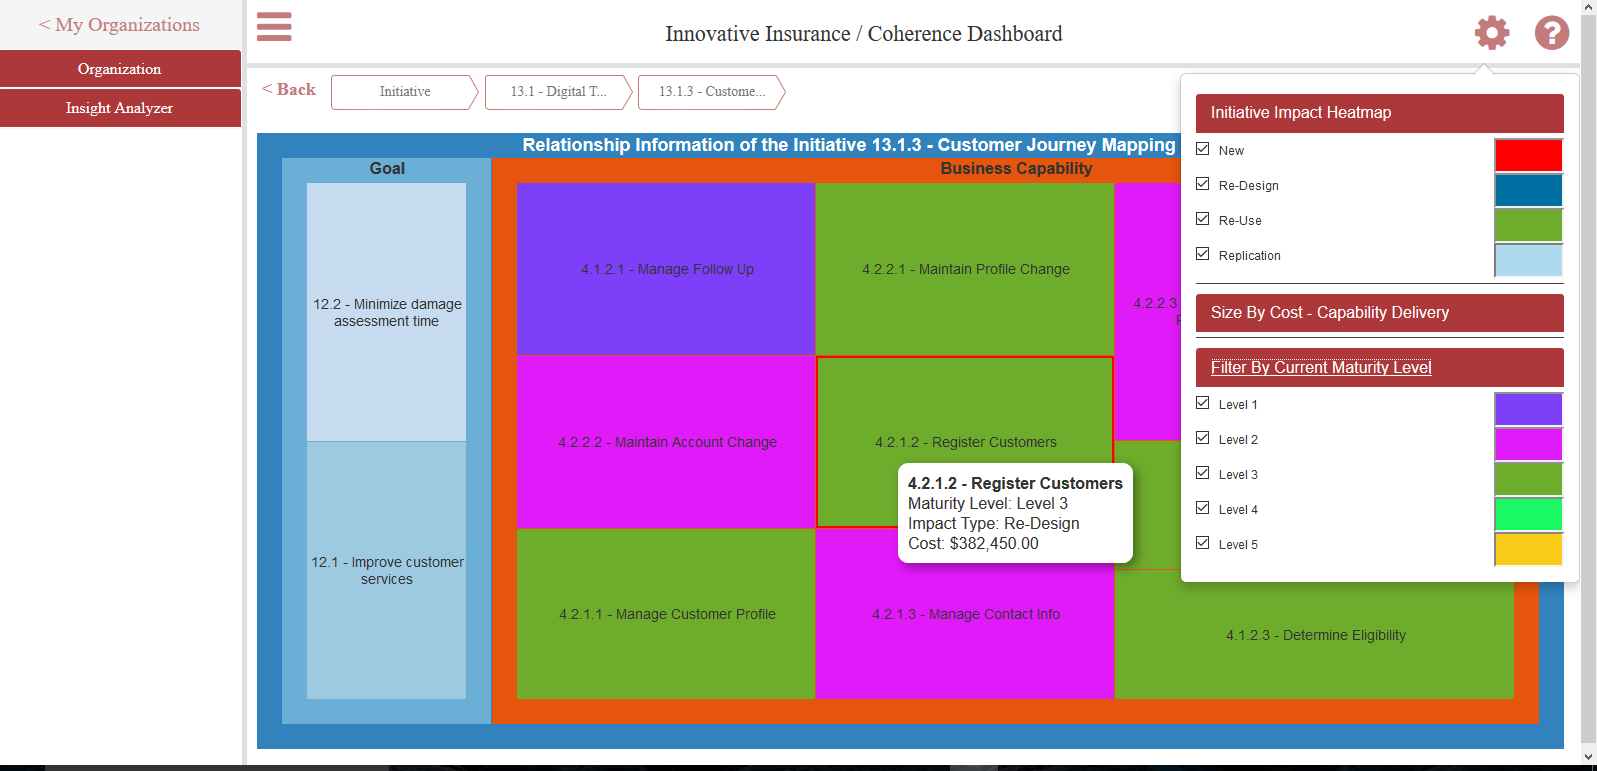 Visualize the Dashboard from many perspectives (eg capability, initiative, resource or architecture phases or strategy). With the support for capability based planning in the Evolver, it’s now very easy to visualize the capability delivery cost or resource allocation costs across initiatives or architecture phases.
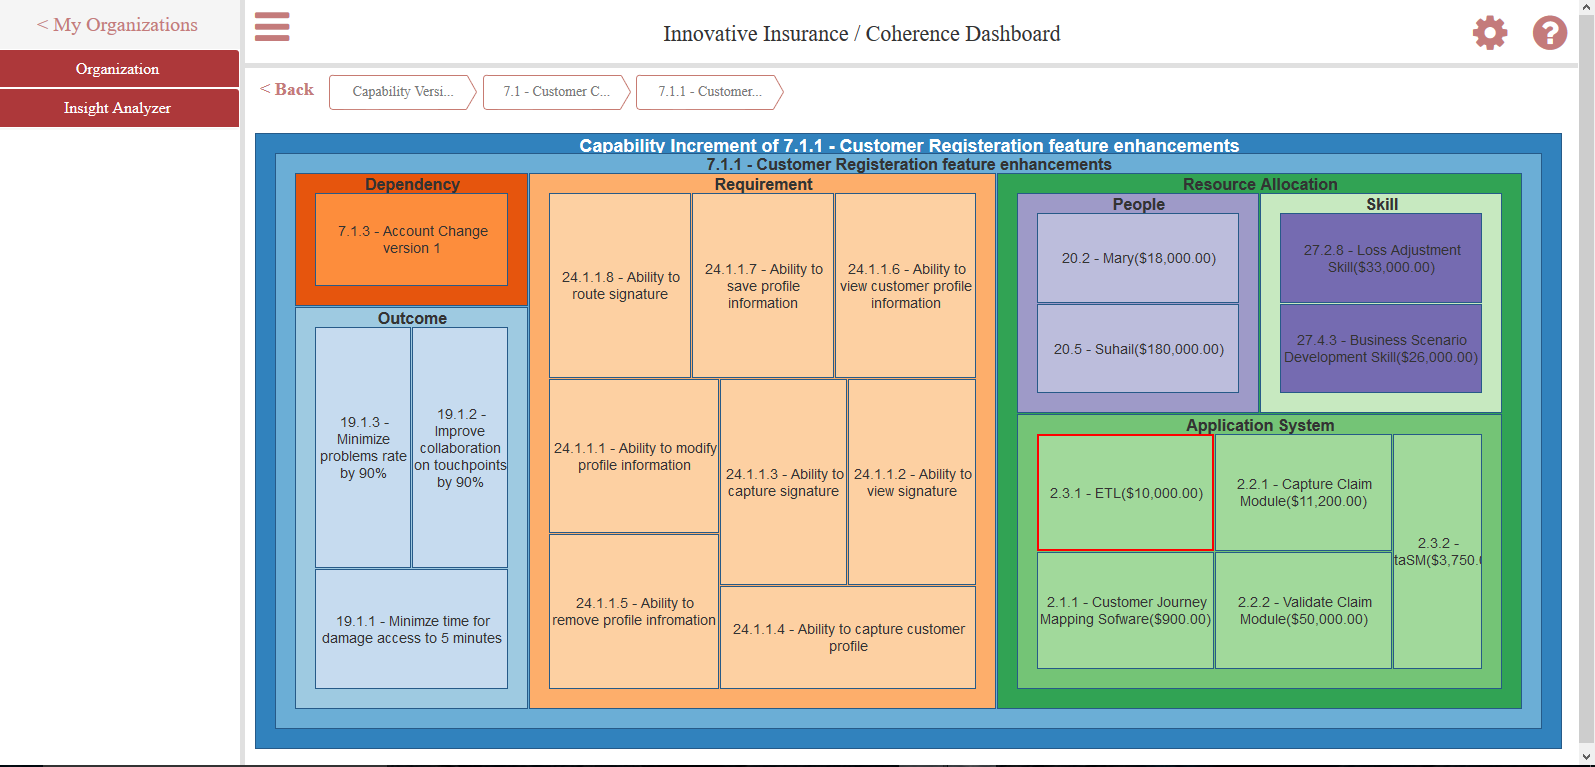
Can you be more specific about the content of your article? After reading it, I still have some doubts. Hope you can help me.
Thanks for sharing. I read many of your blog posts, cool, your blog is very good.
Thank you for your sharing. I am worried that I lack creative ideas. It is your article that makes me full of hope. Thank you. But, I have a question, can you help me?
Your article helped me a lot, is there any more related content? Thanks!
Can you be more specific about the content of your article? After reading it, I still have some doubts. Hope you can help me. 注册获取100 USDT