


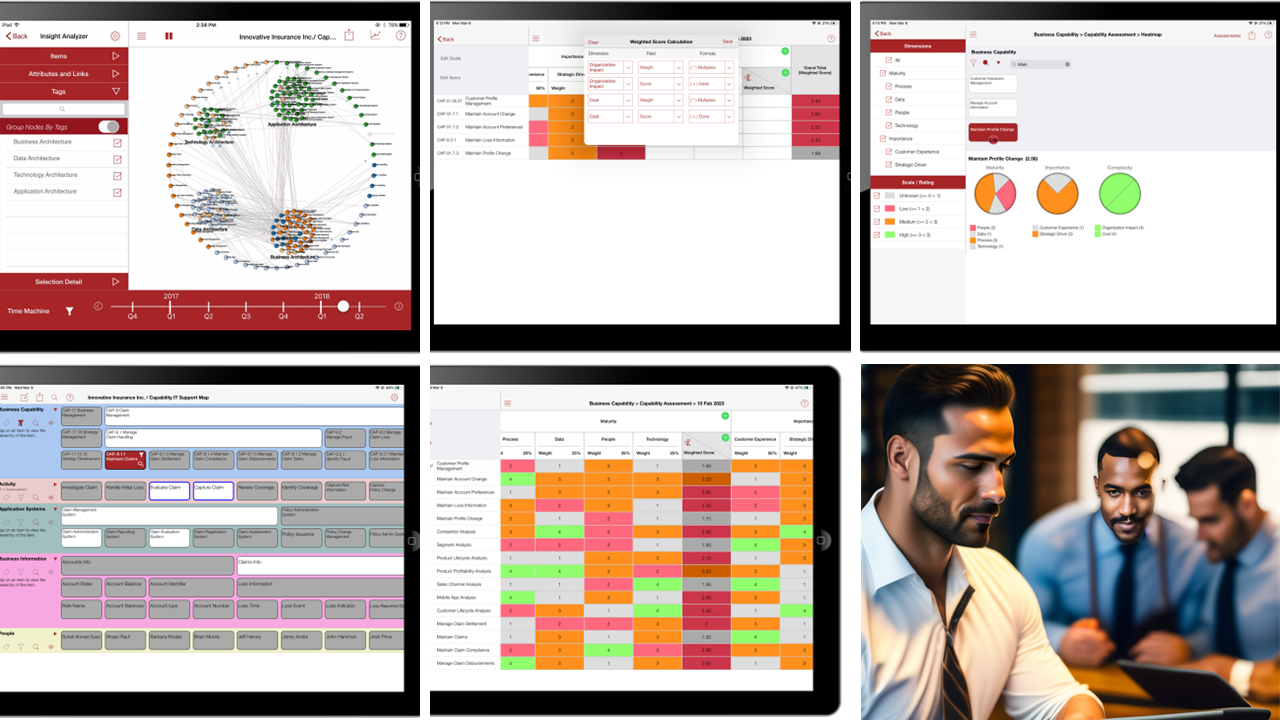
The Insight Analyzer feature of Enterprise Evolver provides many functionalities for users to visualize and analyze enterprise data through interactive directed network graph (“graph”). The Insight Analyzer offer another way to visualize complex relationship.. The network graph consists of a set of nodes and edges. Nodes represent the business parts and edges are the connections that represent links and dependency between the business parts.
Centrality
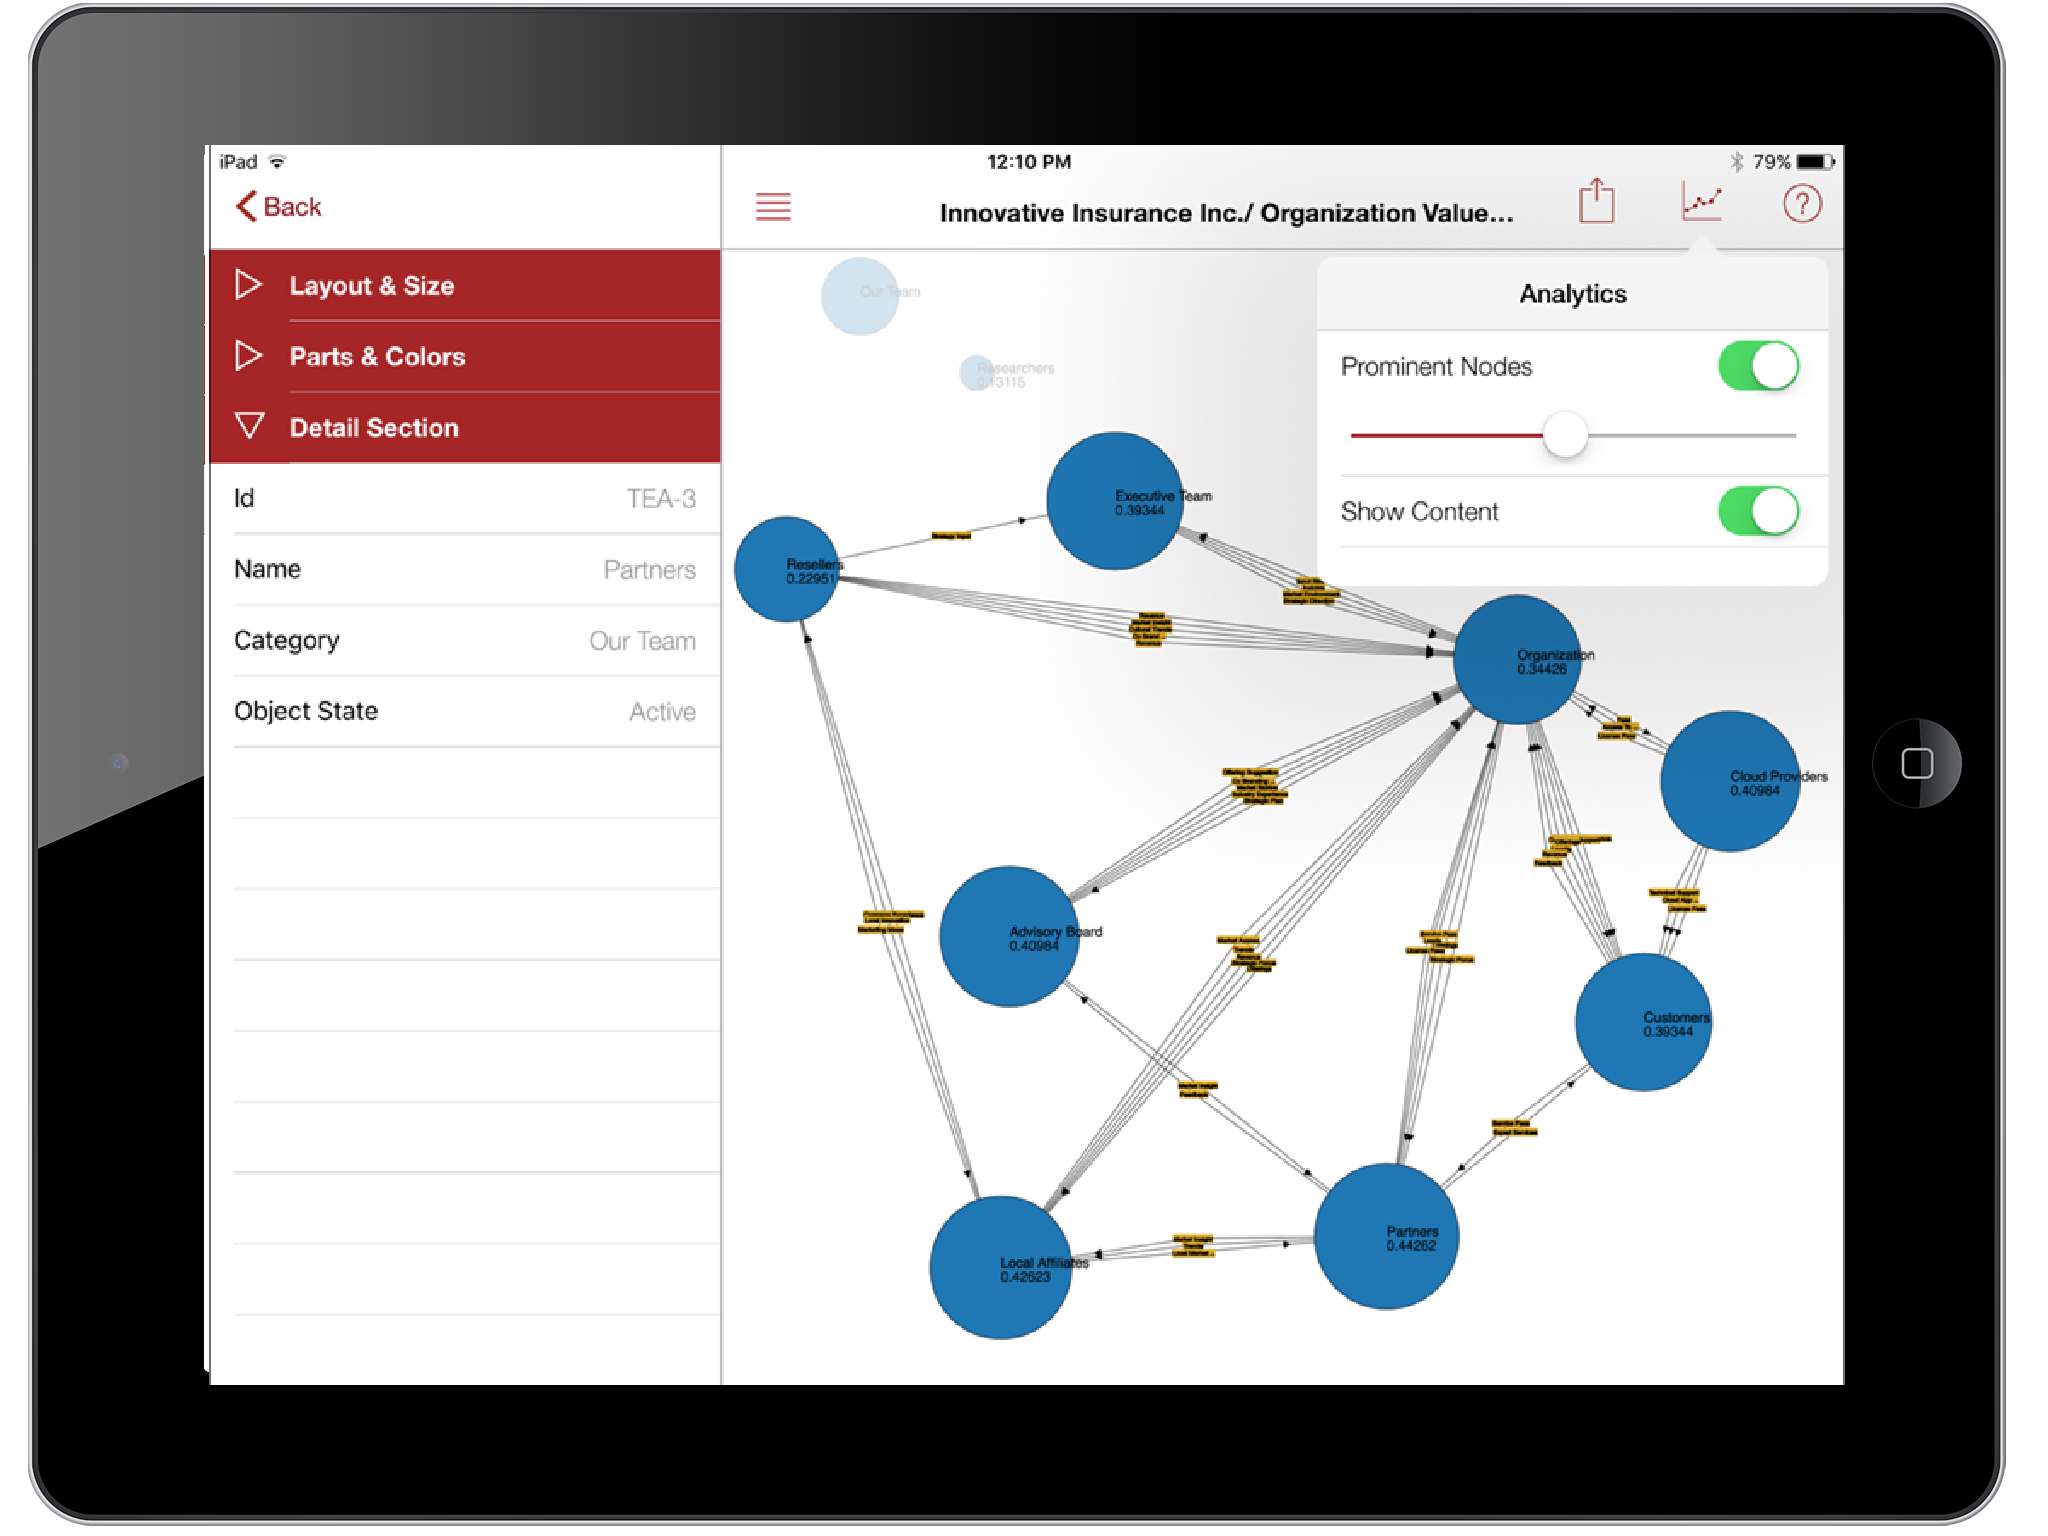
The relative importance of a node within a network graph is called centrality. There are various measures to determine this ranking. In the Evolver app, we use Eigenvector centrality method to compute the centrality or approximate importance of each node in a graph. A highest degree node is a measure of the influence of a node in a network. It’s a good way to identify important nodes/vertices in a network to understand which nodes (e.g. application, capability, people etc.) play a critical role. There is no limit for creating such network graph. Applications include identifying most influential person(s) in a social network, identifying key application systems in your IT landscape, identifying key critical touchpoints in your customer shopping journey where customers make the final decision to purchase.
Flow & Exchange Modeling
The network graph also capture flows between two nodes in a network. The flows can be money, product, information, or services, or combinations of one or more of these. You can create a network graph to depict how value flow among different constituents or stakeholders in your enterprise or to depict an exchange or flow of information between network of applications or services.
Watch this brief video to understand this concept in the Evolver App.
<
