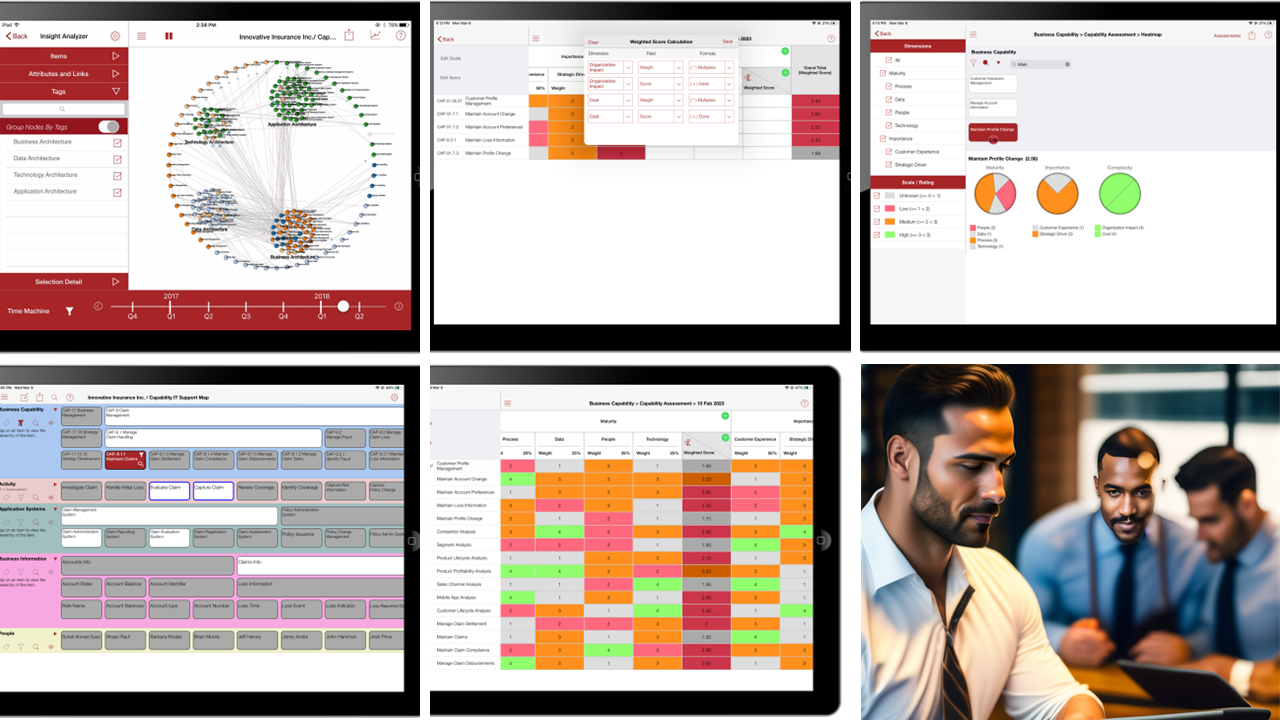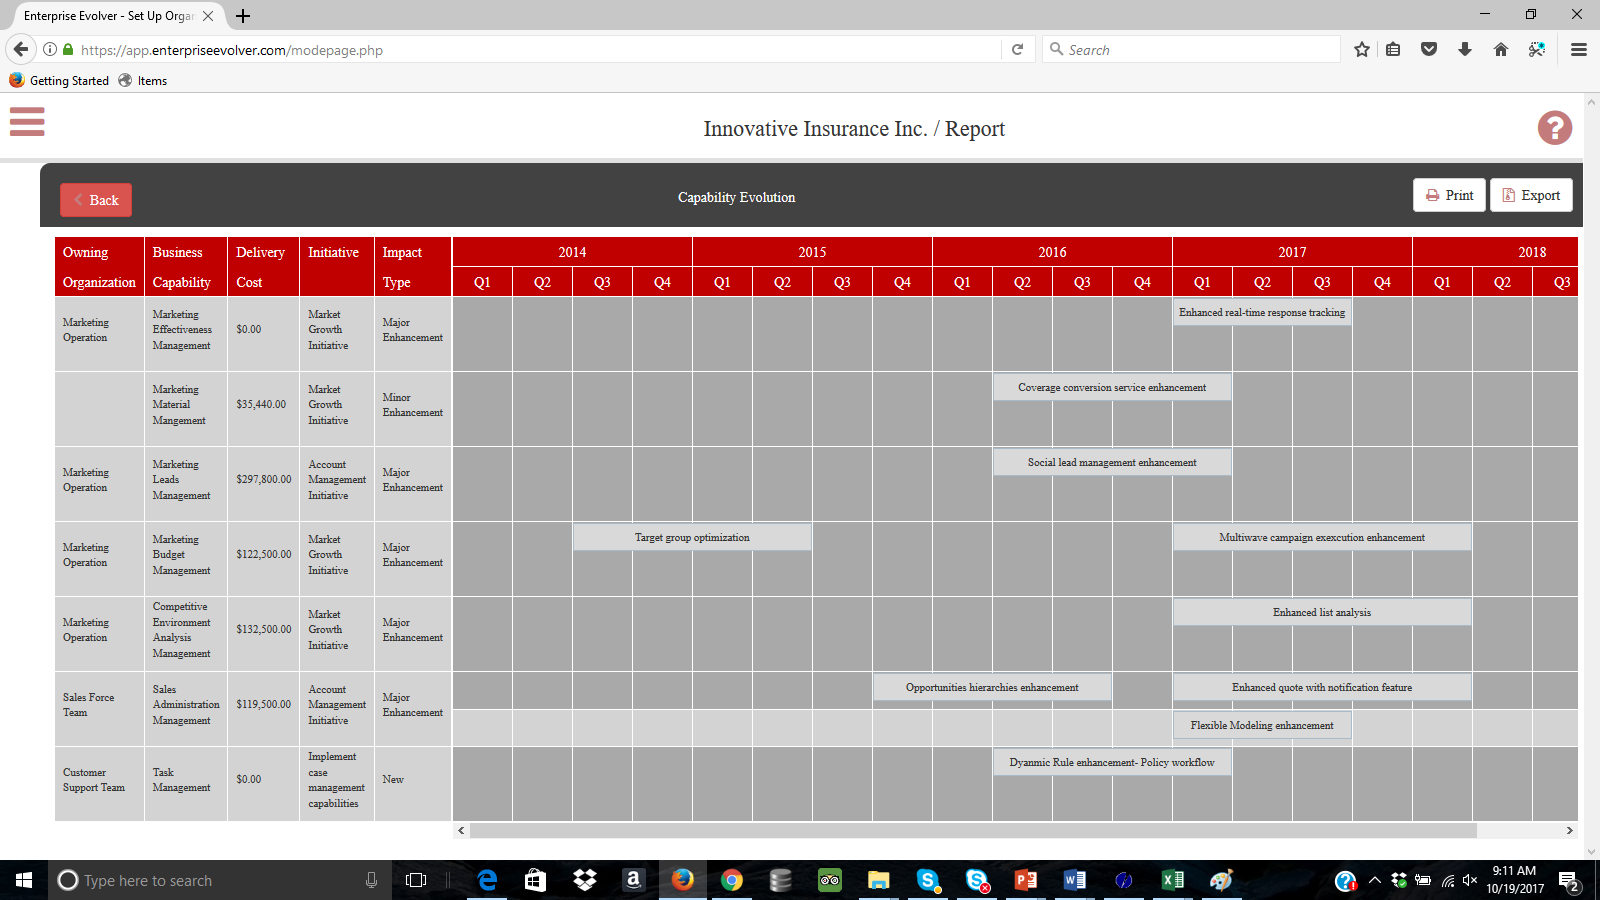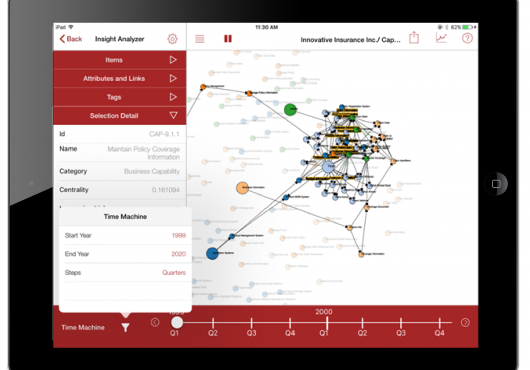
In the latest release of the Enterprise Evolver app, a time machine feature is added. To visualize the network data over time, the Insight Analyzer offers a time machine feature. This feature allows users to visualize the evolution of enterprise in terms of how nodes and connections change over time. For example, users can visualize how business capabilities are evolving as the IT architecture is modernized to support capability evolution. You can visualize what resource and connection are acquired or retired at a given point in time. This function can also be used to depict the future state of the business or to depict a capability roadmap or product roadmap.
You can set start year and end year and the steps (e.g. months or quarters) to visualize the network graph. The time slider can be used to visualize the network as the network changes over time. The time machine can also be used with tags and attributes options to help you analyze the network from multiple dimensions and to visualize how value and information flow across your organization. Visualize the complexity of your business over time with the time machine feature.
Watch this brief video to learn how to use the time machine feature.