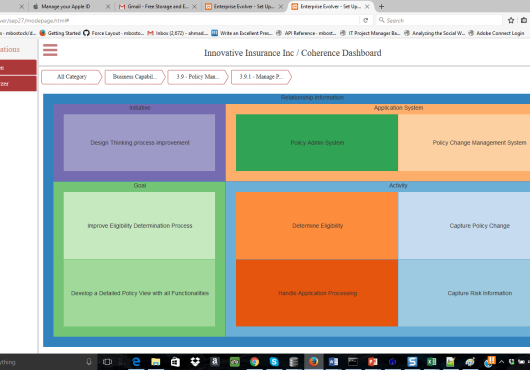
Enterprise Evolver now offers a dashboard feature “Coherence Dashboard” for web/browser version.
The Coherence Dashboard(“Dashboard”) automatically generates a visualization based on the hierarchal and relationship data captured through the Configurator feature. It displays the current status of structural data relevant to the enterprise. The Dashboard map automatically assigns a unique color to each box. By clicking on a category, you can go to it’s leaf node, essentially examining a tree of any business part of the enterprise. Then from the leaf node (lowest level) , you can also drill down to the relationship data (all links) browsing all the connections and interconnections. The boxes size is determined by the amount of incoming links or outgoing links or total links or by the cost of resources and capabilities. When the incoming link option is selected, the larger box indicates that there are more other business parts depend on it. When the outgoing link option is selected, the larger box indicates that the selected box depends more on other business parts. The larger box more it is important and more the dependency and complexity. The larger box also represents the highest priority for improvement or investment considerations.
In an organization, the size of the boxes and the connection between the boxes will keep changing in response to the external environment and real world pressure. The dashboard holds all the changes and connection together.