

In this article, you will learn how to quickly create an impressive dashboard using your own BI /analytics tool such as Microsft Power BI. Enterprise Evolver allows you to export data to an excel spreadsheet. These spreadsheets can be used by any BI tool to create charts and dashboard. In this example, we will create a capability dashboard. You can also create a dashboard for application and technology or for any other resource. Please follow these three steps:
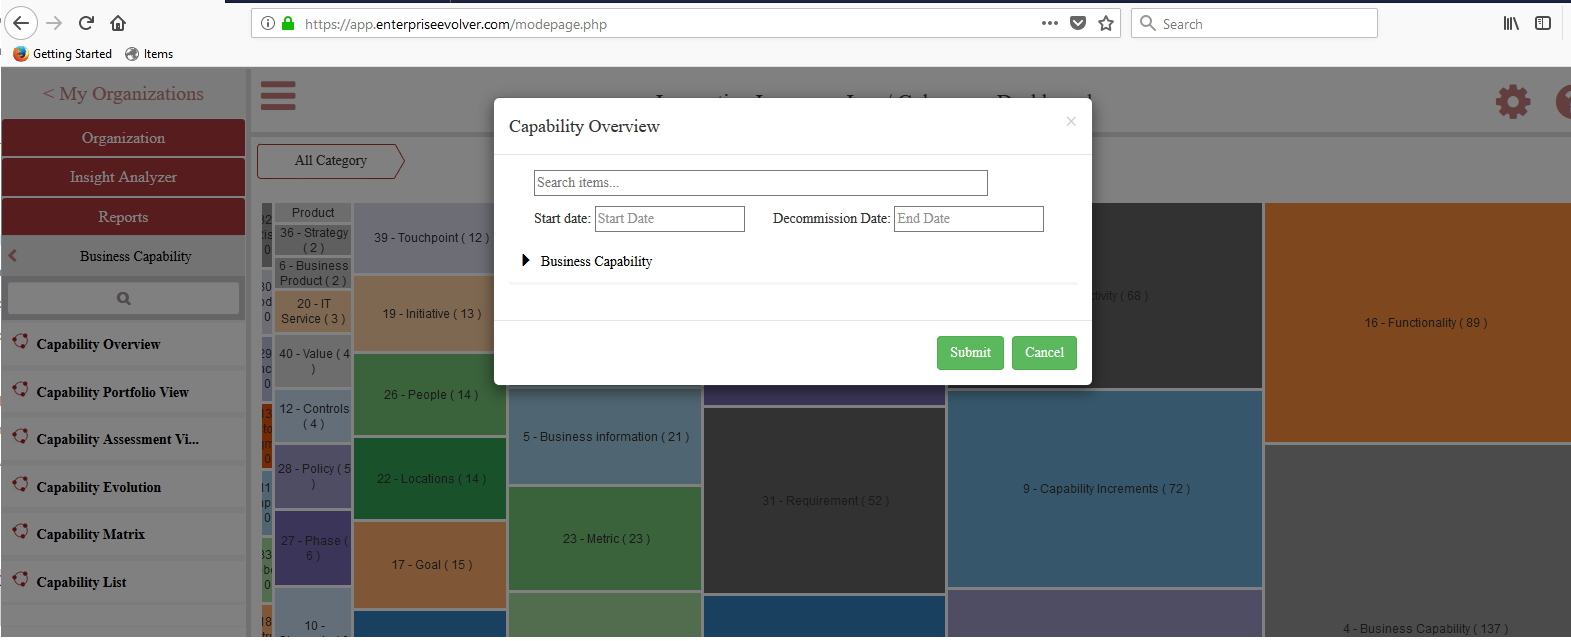
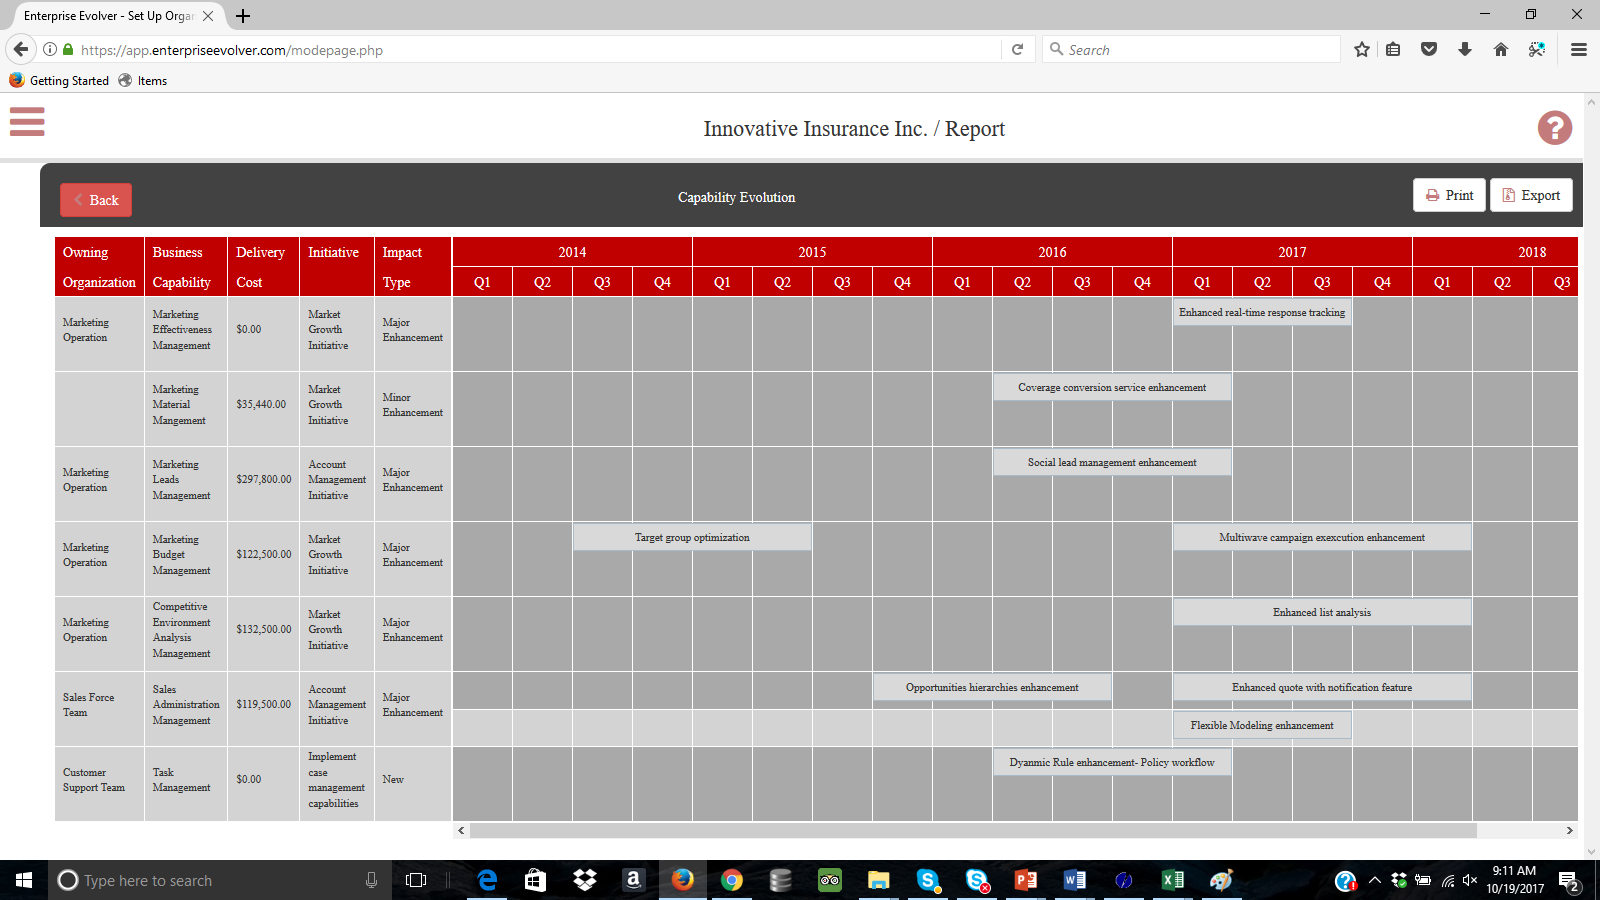
- Under Report section, select capability overview report and select those capabilities that you need to include in the dashboard. An HTML report is generated.
- Click on Export button and select the option Excel. An excel like this below will be generated.

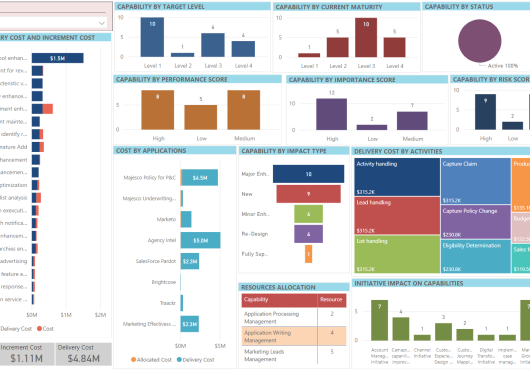
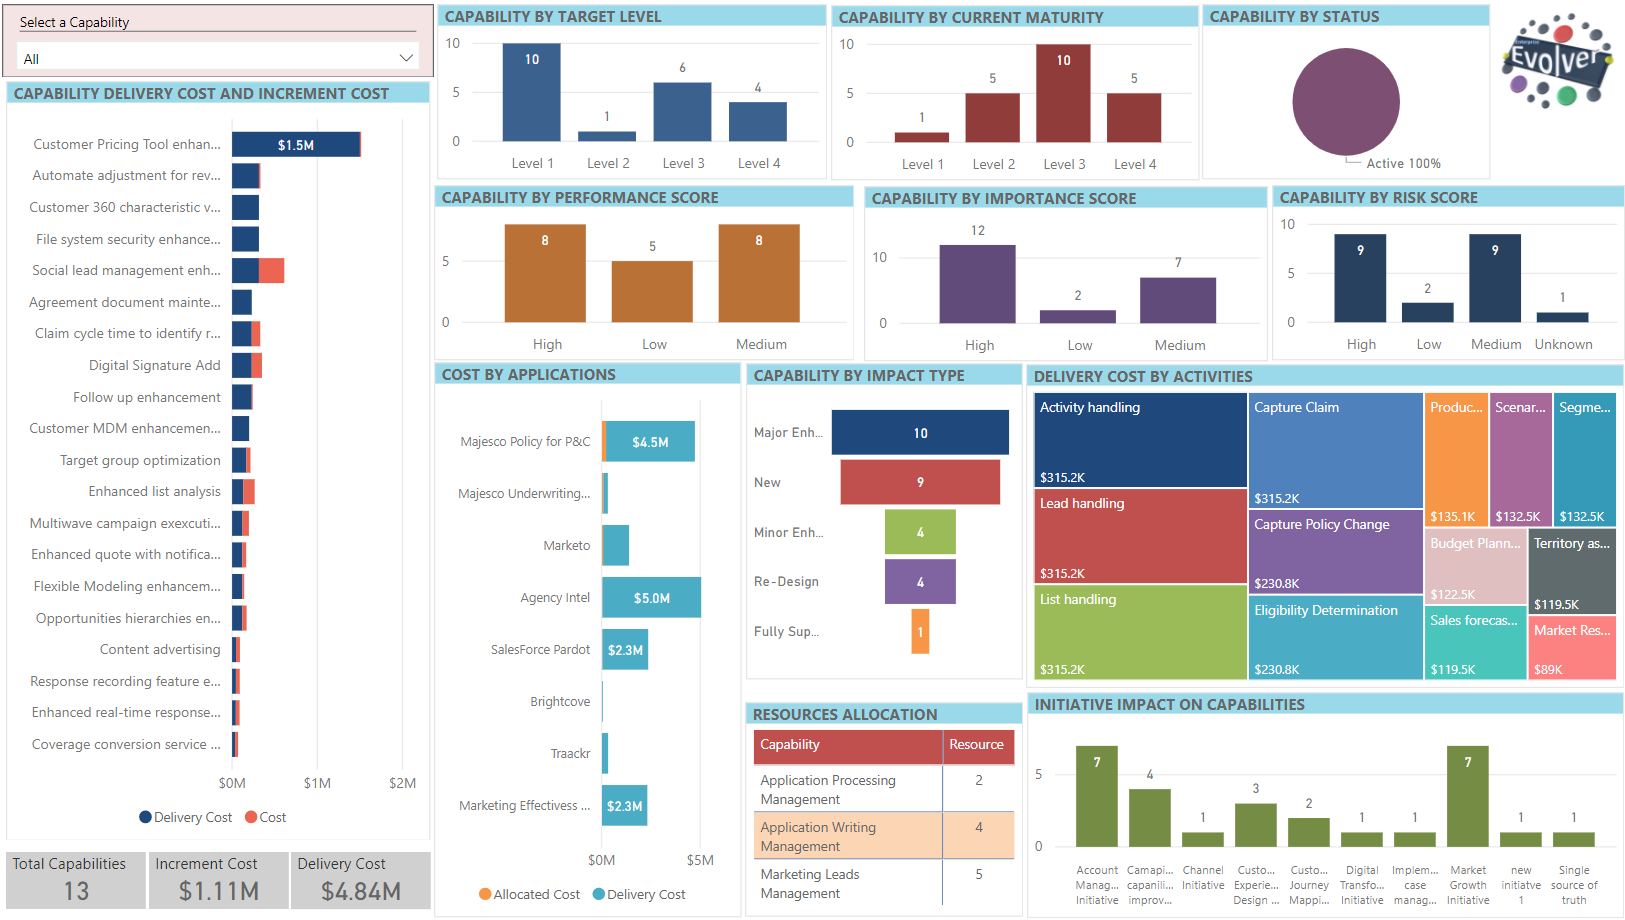
- Connect this excel with your BI tool and use appropriate data visualizations to generate the Dashboard. A sample dashboard created using Power BI is depicted below. Share the dashboard with your stakeholders and keep everyone informed about the business evolution.

Can you be more specific about the content of your article? After reading it, I still have some doubts. Hope you can help me.
Thank you for your sharing. I am worried that I lack creative ideas. It is your article that makes me full of hope. Thank you. But, I have a question, can you help me?
Super au sujet de cette analyse. Je pense que les systemes de paris comme la montante sont tres idealisees. Pourtant, comme le explique, la maison garde toujours un avantage certain. Il ne faut pas penser qu’une methode infaillible existe. Pour ma part, le jeu doit rester un passe-temps raisonnable. Reference : [url=https://nished.blogolize.com/casino-en-ligne-gratuit-jouez-sans-risque-et-sans-dГ©pГґt-80712955]cet article[/url]
Thanks about this guide. In my opinion that most systems are often overrated. But, as, the house always has an edge. It is risky that a secret system works. Gambling must stay a controlled hobby. Source : [url=https://miltonperez.jofo.me/2460133-free-spins-without-wagering-requirements-explained.html
]payid pokies australia no deposit bonus codes
[/url]
Thanks for sharing. I read many of your blog posts, cool, your blog is very good.
Your point of view caught my eye and was very interesting. Thanks. I have a question for you.