In this article, you will learn how to quickly create an impressive dashboard using your own BI /analytics tool such as Microsft Power BI. Enterprise Evolver allows you to export data to an excel spreadsheet. These spreadsheets can be used by any BI tool to create charts and dashboard. In this example, we will create a capability dashboard. You can also create a dashboard for application and technology or for any other resource. Please follow these three steps:
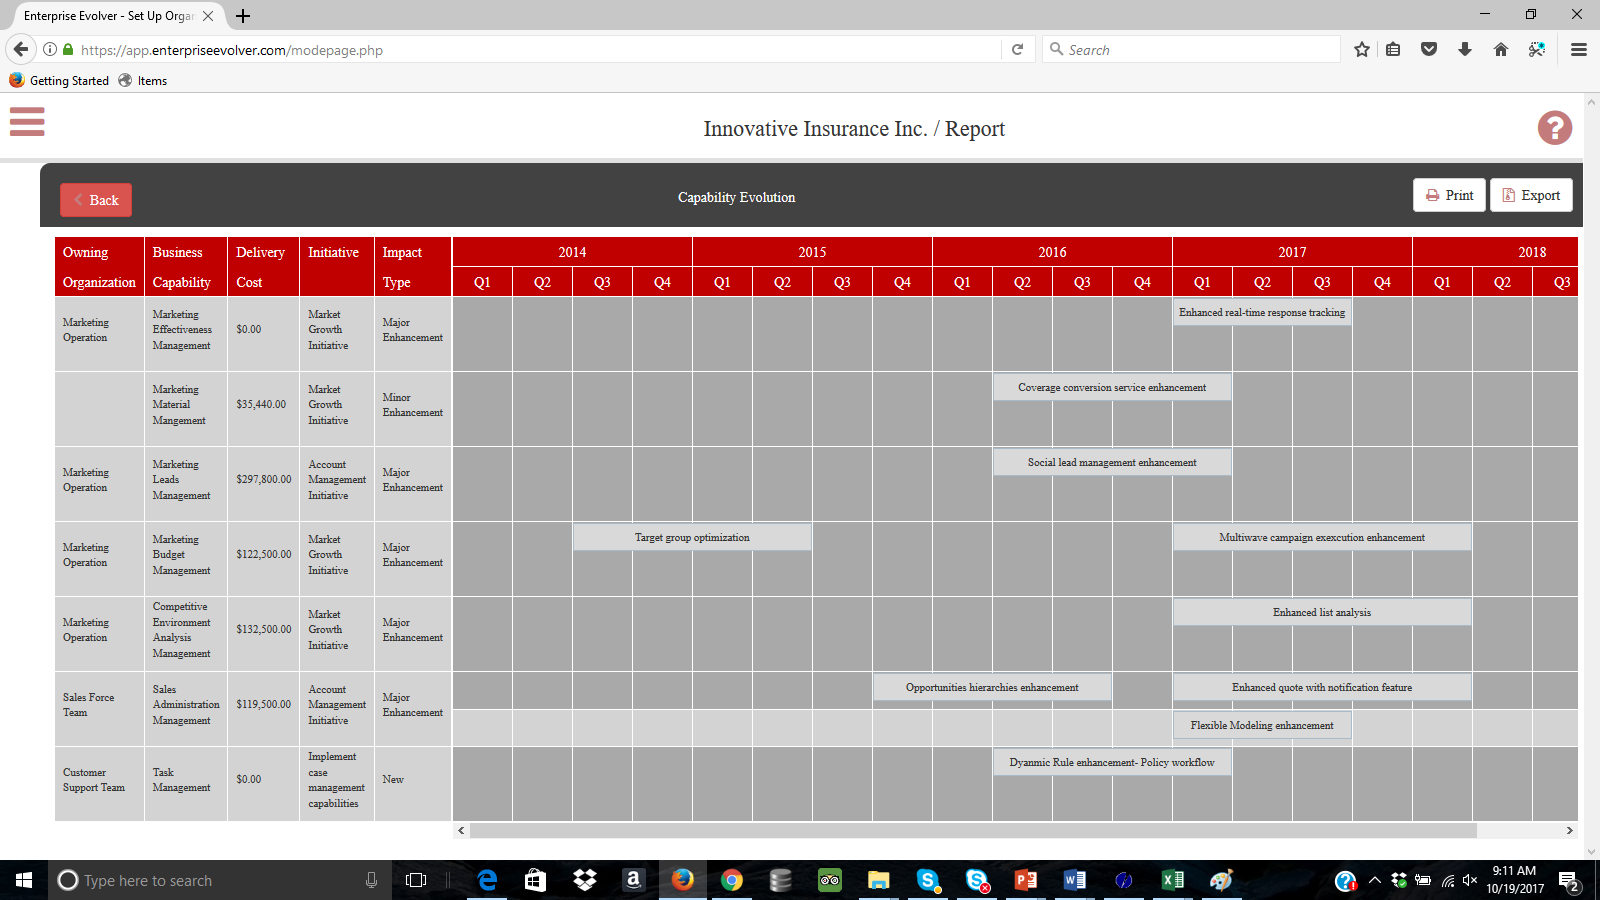
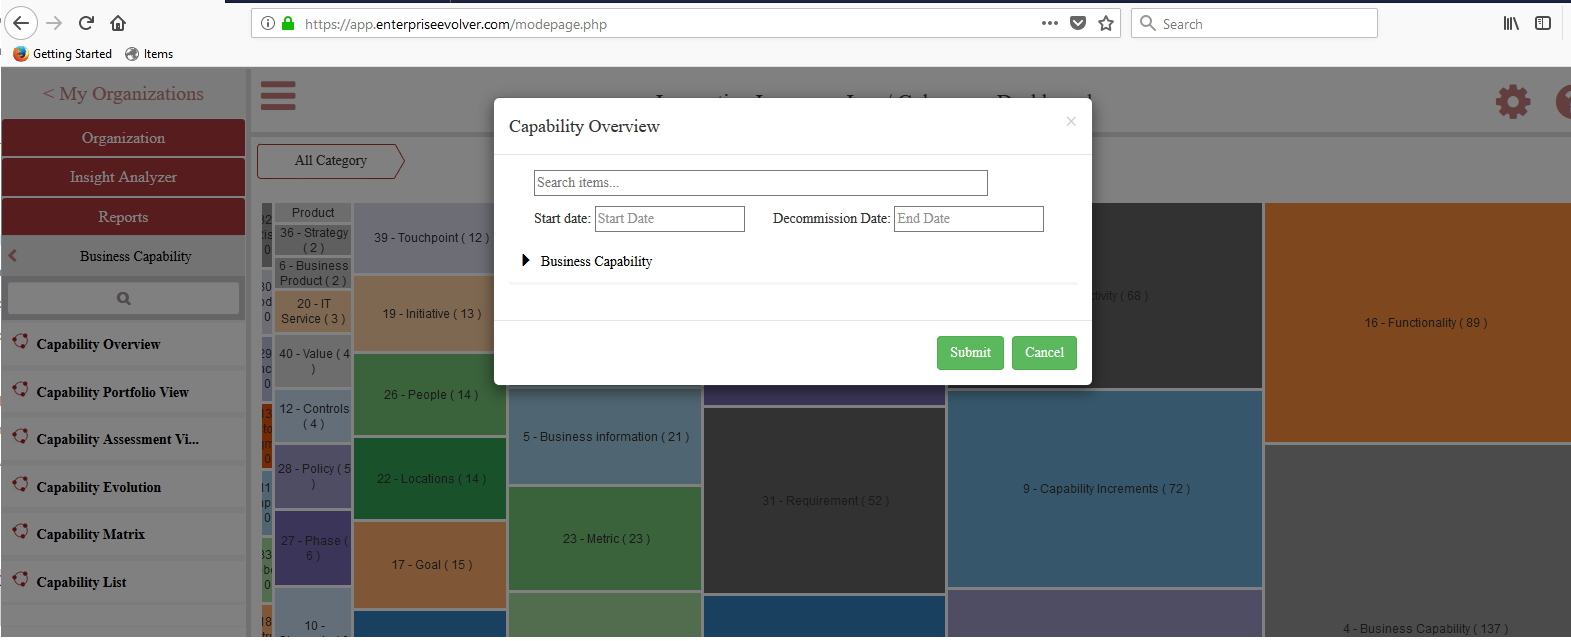
- Under Report section, select capability overview report and select those capabilities that you need to include in the dashboard. An HTML report is generated.
- Click on Export button and select the option Excel. An excel like this below will be generated.

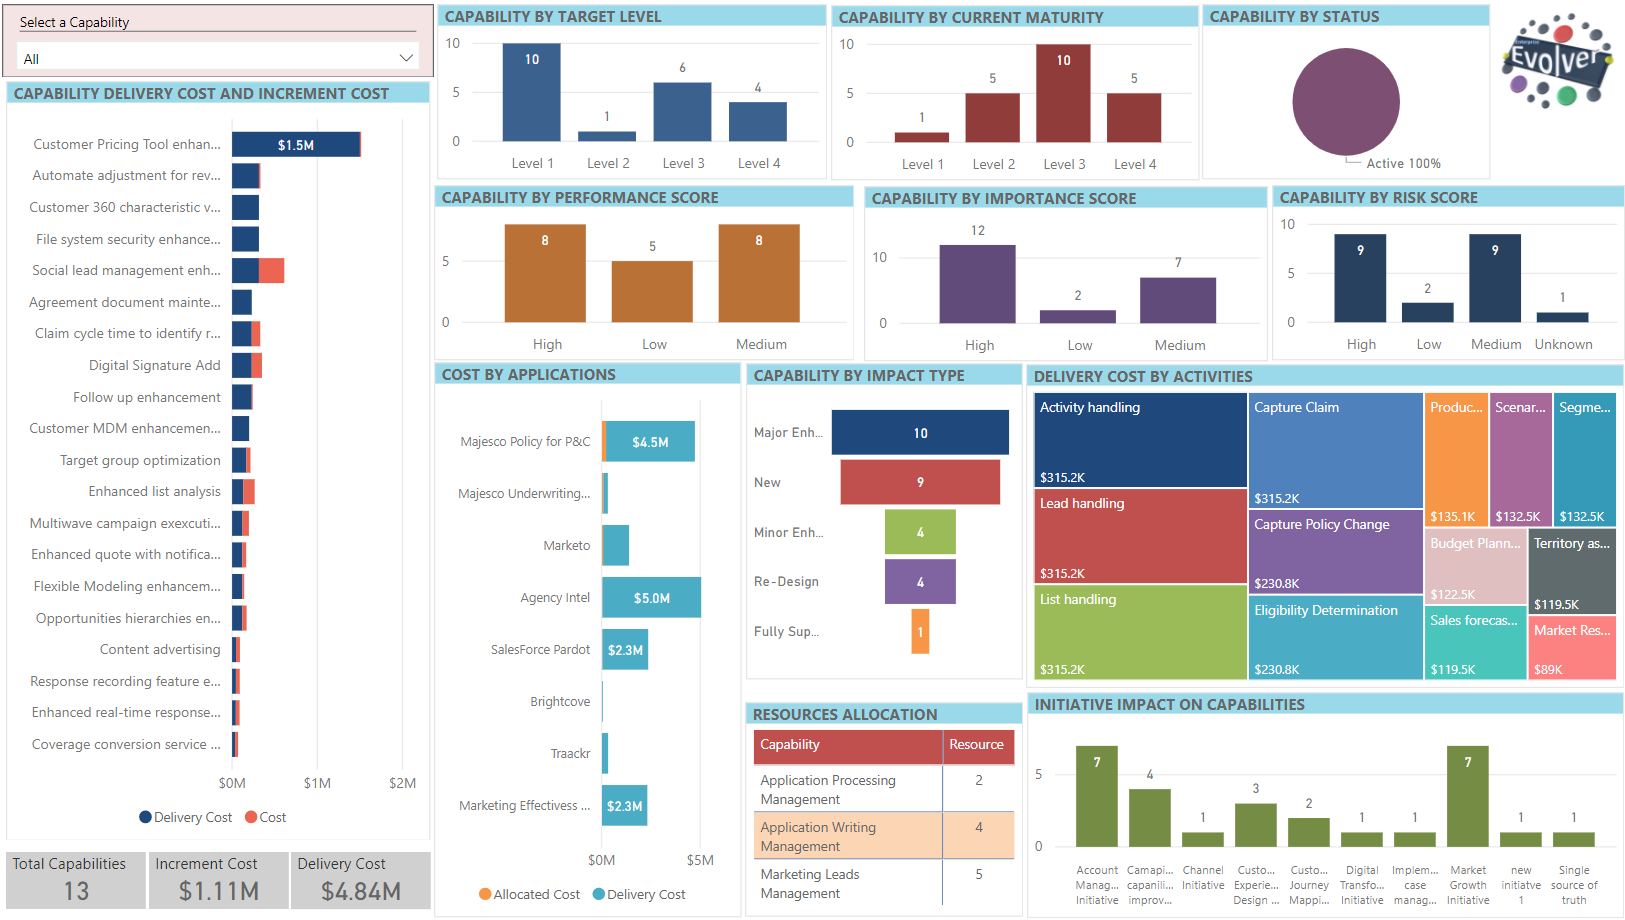
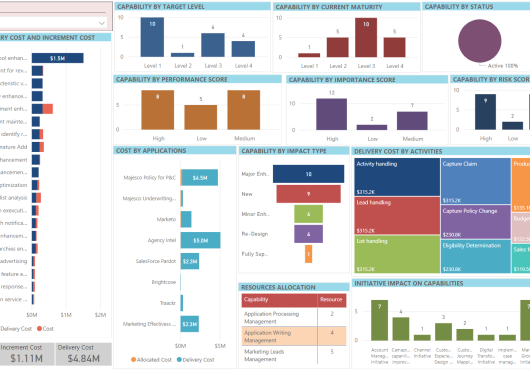
- Connect this excel with your BI tool and use appropriate data visualizations to generate the Dashboard. A sample dashboard created using Power BI is depicted below. Share the dashboard with your stakeholders and keep everyone informed about the business evolution.